Before You Buy a Robot, Simulate It First
Simulate before you buy because a robot's output depends on the line around it. A robot with a fast cycle on the spec sheet can still wait for parts, block the next station, or sit at a step that was never the bottleneck. A simulation of the line shows, before the purchase order, whether daily output rises, by how much, and what else has to change: buffers, transport, staffing or the order in which work is released.
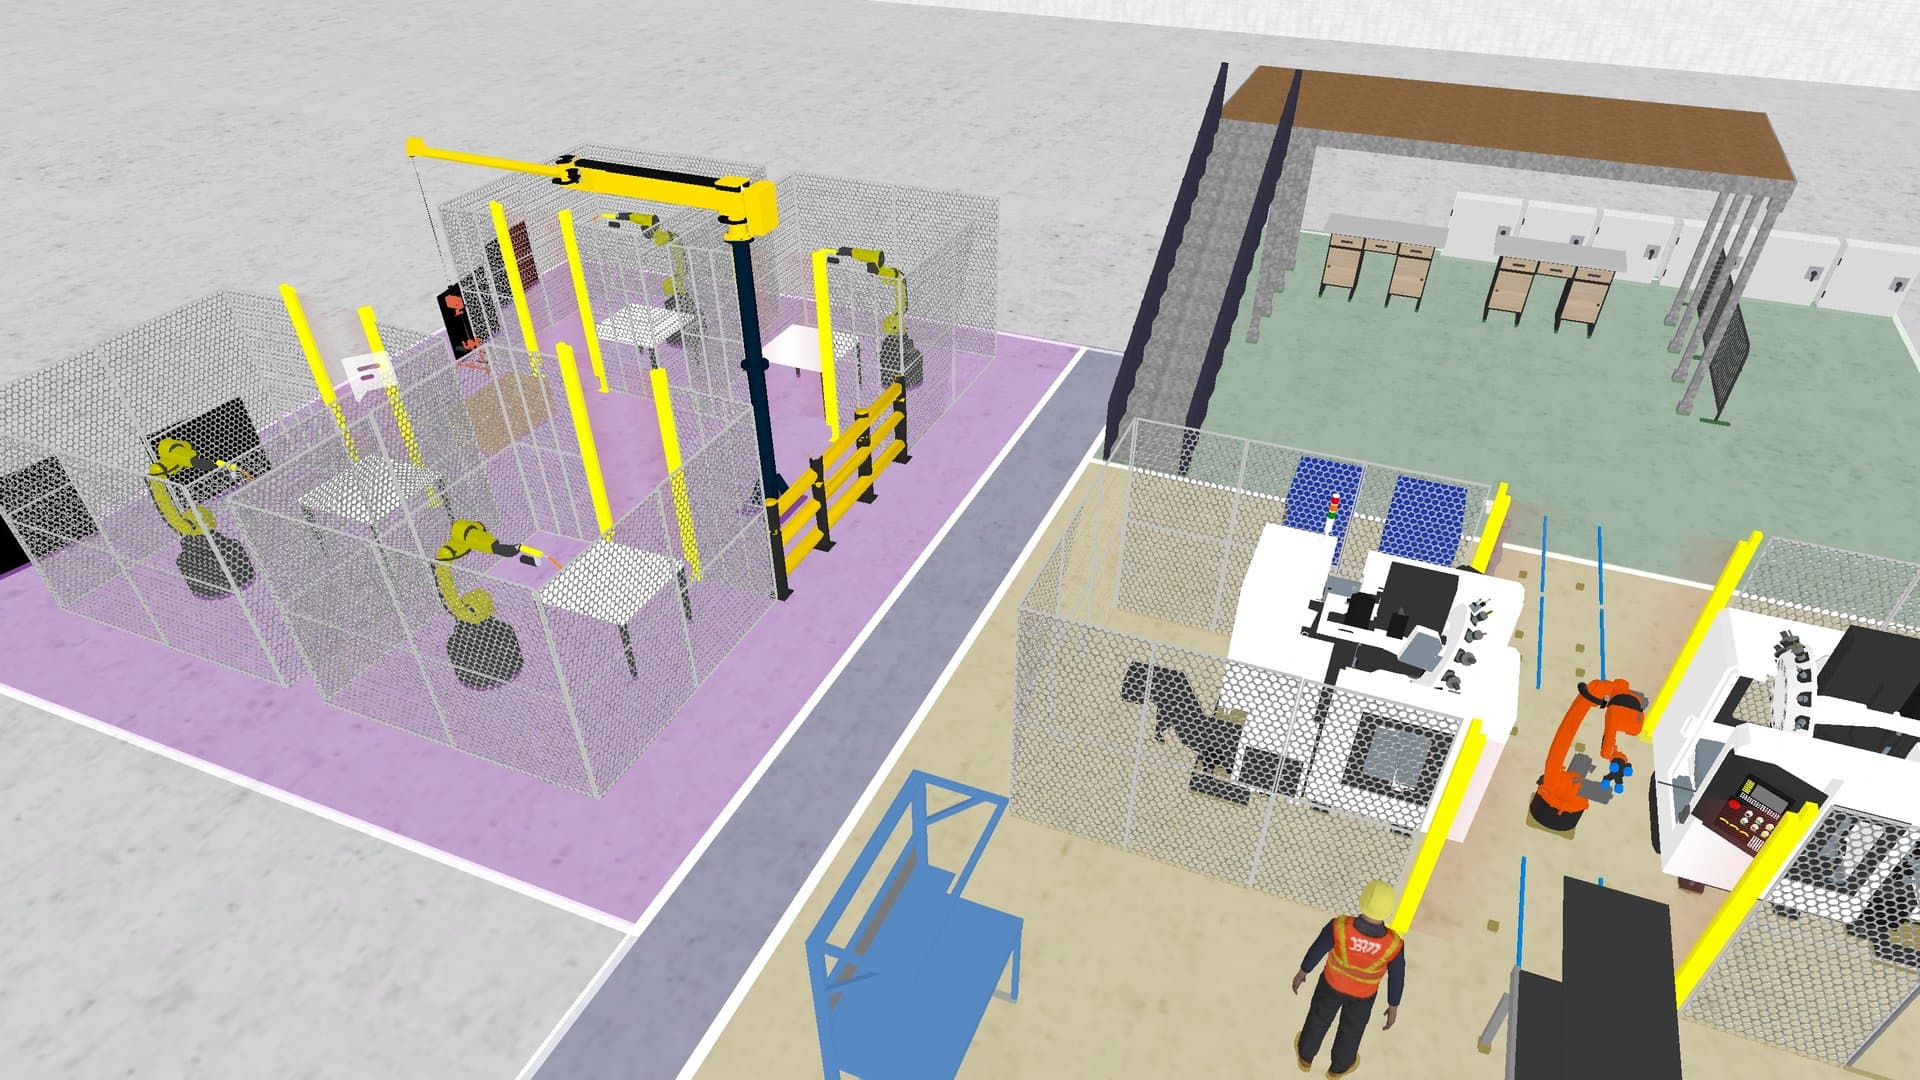
Why robots miss their expected output
Most disappointing robot projects are not technical failures. The robot does what the supplier promised, and the line around it holds it back. The usual reasons:
- The robot sits upstream of the real constraint, so the faster station only builds a longer queue in front of it.
- The robot is starved. Parts arrive late because a forklift is busy, a buffer is empty, or the operator who feeds it is doing two other jobs.
- The robot is blocked. The next station is slower or stops more often, so finished parts have nowhere to go.
- The business case used an average cycle time. On the floor, manual steps around the robot vary from part to part and from shift to shift.
- Changeovers and mix were left out. A cell that runs well on one product family loses time when the order mix changes during the week.
All five come from timing and interaction on the line. Neither a spec sheet nor a layout drawing shows them.
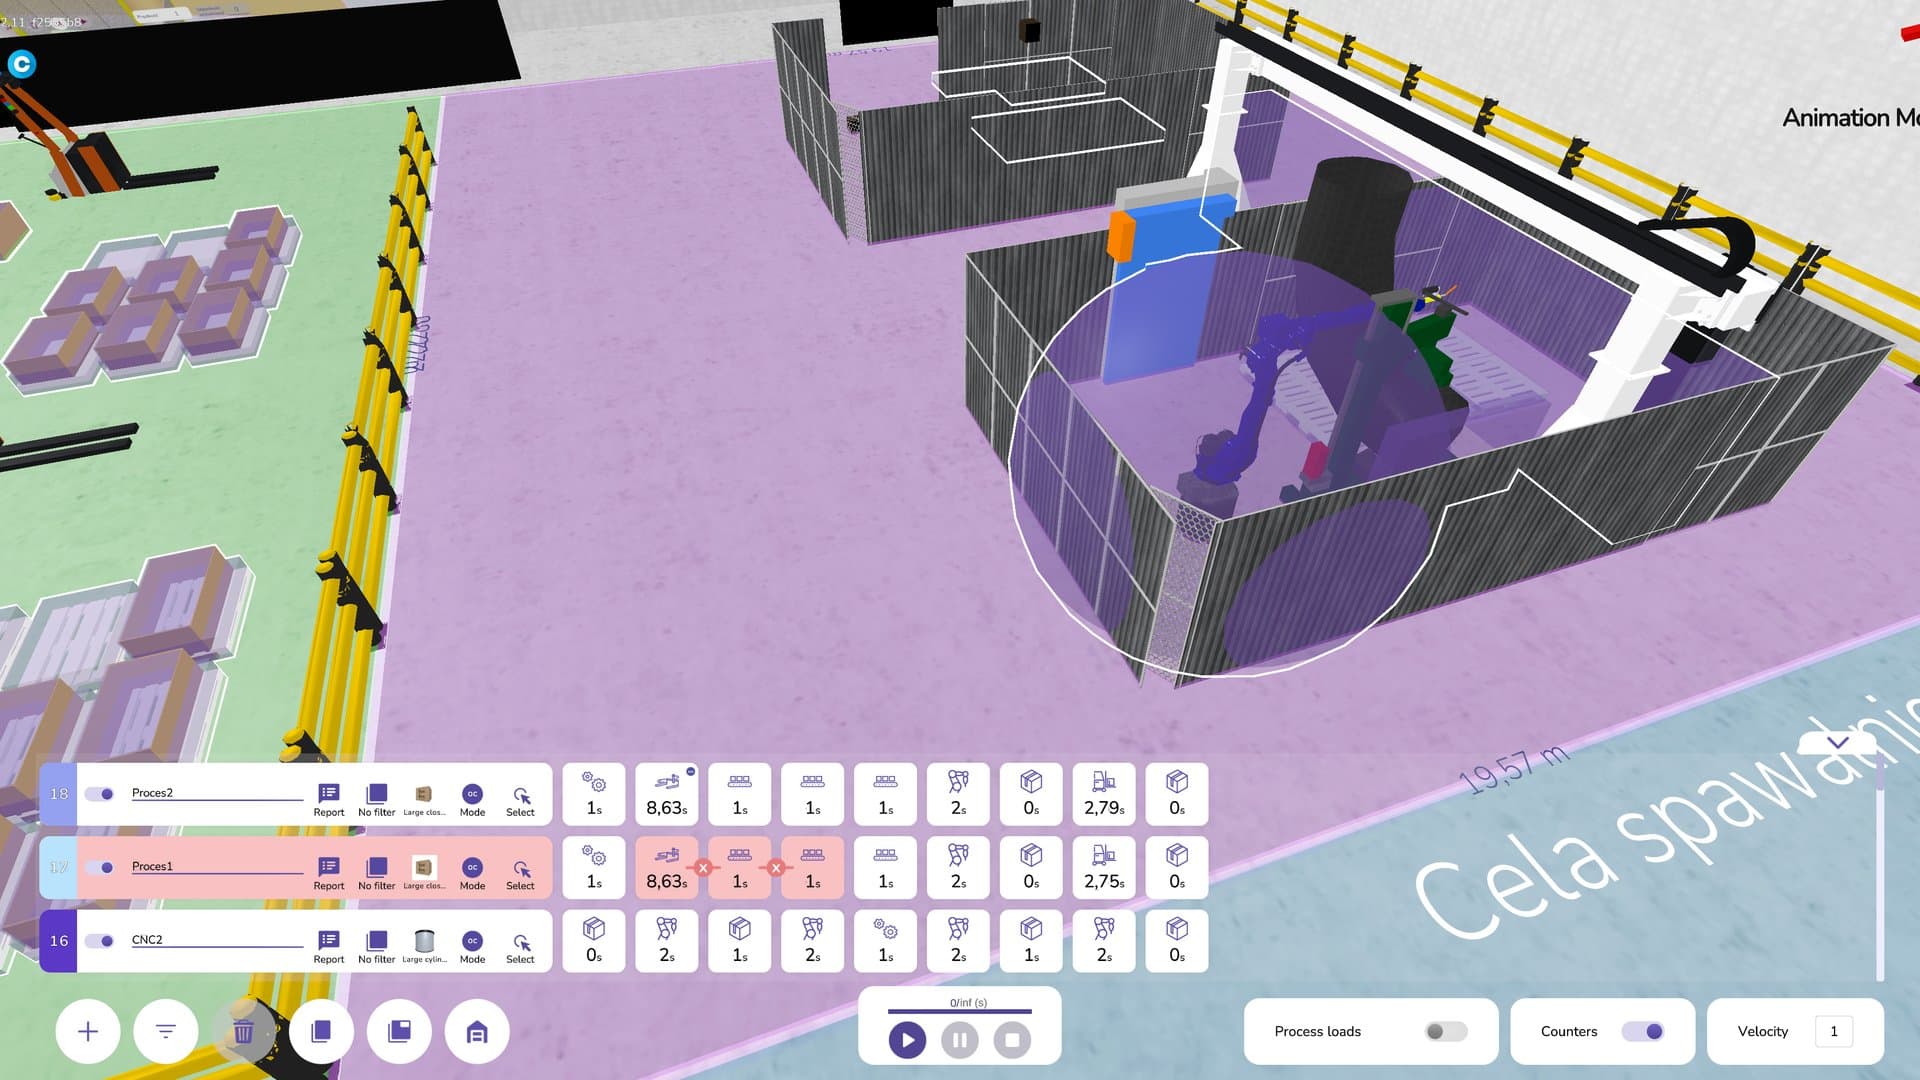
Start with the cycle target, not the robot
Before anyone talks about grippers, write down what the line has to deliver: the takt time from the order plan, the cycle time of each station, and where the time goes.
Consider an illustrative line that has to make one part every 60 seconds. A manual assembly station averages 55 seconds, so on paper it is fine and a robot there would look like a pure labor saving. But the station's times range from 45 to 75 seconds, and the next station waits for it about a third of the time. So the question to ask is which change brings the line to 60 seconds on a bad day, and at what cost. Sometimes the answer is a robot. Sometimes it is a buffer, a second operator on one shift, or an autonomous cart that takes walking out of a manual job.
A simulation splits every station's time into work, waiting for material, waiting for the next station and stops. With that split you can see where an investment pays and where it would only move the queue.
What to check before you ask for quotes
You do not need a model of the whole plant. You need the part of the flow that feeds and drains the planned robot, run with your real order mix.
| Question | What the spec sheet or quote says | What a simulation of the line shows |
|---|---|---|
| How fast is the robot? | Cycle time under ideal conditions | Cycle time inside your flow, with waiting and blocking |
| Will line output rise? | Usually assumed | Units per shift before and after, as a range |
| Is this the right station? | Not covered | Where parts actually queue, and whether the queue moves after the change |
| What happens on a bad day? | Not covered | Output with stops, slow manual steps and mix changes |
| What else must change? | Not covered | Buffer size, transport, staffing per shift |
For the bad-day row, DBR77 Digital Twin enters cycle times and stops as ranges from historical behavior (stochastic simulation).
A real case: the bottleneck was waiting, not work
A plastic injection molding company in central Poland, supplying the household appliances industry, with over 200 people on three shifts and a 20,000 m2 site, wanted to automate and robotize several stations on one line. The questions were technical feasibility, OEE and productivity, alternative automation scenarios and the economics of each.
DBR77 built a digital twin of part of the plant, with material flows and cycle times for each task. The model showed which tasks had the greatest procedural, economic and ergonomic value for automation. It found that:
- the bottleneck was a manual step by the first operator, with 90 seconds of activity and 98 seconds of waiting, so the loss came from waiting time;
- replacing that operator with an autonomous cart increased efficiency by over 100%, which created the conditions for the investment to be economically viable;
- automating intralogistics, including non-ergonomic tasks, and automatic quality control were the proposed next steps.
A later iteration simulated automated transport between stations, with efficiency, productivity and working-time reports for each variant. The variant analysis took only a few days. According to the model, the money belonged in moving material between stations, and the busiest-looking station could wait.
See how automation decisions are tested
In the molding case, the better investment turned out to be an autonomous cart that moved material. Other DBR77 Digital Twin use cases cover robot cells, intralogistics and line balancing tested before the purchase.
Compare automation variants, not just robot or no robot
"Robot yes or no" is a weak question. A stronger one compares three or four variants on the same measures, with the same order mix and the same stops:
- The line as it is today.
- The robot the team proposed, at the station it proposed.
- A cheaper change at the real bottleneck: a buffer, an autonomous cart, a rebalanced task split.
- The robot plus the supporting change it needs to reach its output.
Compare units per shift, waiting time, utilization and operator working time. If variant 3 delivers most of the gain for a fraction of the money, you have saved a CAPEX request. If only variant 4 reaches the target, you know the full scope before you sign. When several variants look plausible, use the method in How to Compare CAPEX Options When Every Scenario Looks Plausible.
From simulation to supplier brief and business case
A good simulation also produces a clear brief for suppliers: the required cycle time inside the flow, the buffers around the cell, the transport concept and the shifts it must cover. Suppliers then quote against your line.
In the injection molding case, the target transport concept made it possible to select a technology provider efficiently through the DBR77 Marketplace. The model defined the job, and the Marketplace matched it to providers.
The same numbers feed the business case. Finance gets output per shift before and after, as a range, plus the cost of the supporting changes, which is a better starting point than a supplier's payback slide. We explain how to build that case without made-up numbers in How to Build a Digital Twin Business Case.
FAQ
Do we need a model of the whole plant to evaluate one robot?
No. Model the flow that feeds and drains the robot, plus shared resources such as forklifts or operators. Expand the scope only if the change affects other areas.
Can the robot supplier's simulation replace a line simulation?
Not fully. A supplier's simulation usually checks reach, cycle time and collisions inside the cell. A line simulation checks whether the cell gets parts on time and whether the line output rises.
What data do we need to simulate a robot investment?
Cycle times of the stations around the cell, as ranges, plus transport times, buffer sizes, shifts and the order mix. Most of this exists in routings and ERP, and the rest can be measured by hand.
How long does a variant analysis take?
It depends on scope. In the published injection molding case, the analysis of automation variants took only a few days.
Conclusion
If a robot quote is already on someone's desk, find out first how much of the target station's time is waiting. Ask for a week of stopwatch or machine data on that station and the one after it. If waiting is a large share, put the cheaper change at the real bottleneck into the comparison before the CAPEX request goes out.
Test your robot investment before you sign
Note the station you want to automate and the takt it has to hit. The demo shows how DBR77 Digital Twin compares automation variants on operator working time and units per shift.
Sources
- DBR77, Case study: Development of an automation concept
- DBR77, DBR77 Marketplace
- DBR77 Digital Twin, Deterministic vs stochastic simulation
Want to test a decision from your plant?
Book a demo and we will show how DBR77 Digital Twin compares the options on output, waiting time and transport load.