What Data Do You Need to Start a Factory Simulation?
You need less data than most plants expect. A first factory simulation needs a layout, process routings, cycle times entered as ranges, changeover times, resources such as people, shifts, forklifts and carts with their speeds, the order mix for a typical period, and the rules for releasing and moving work. Most of it already sits in CAD, ERP and routing sheets. What is missing can usually be measured by hand on the shop floor. Live machine data is not needed to start.
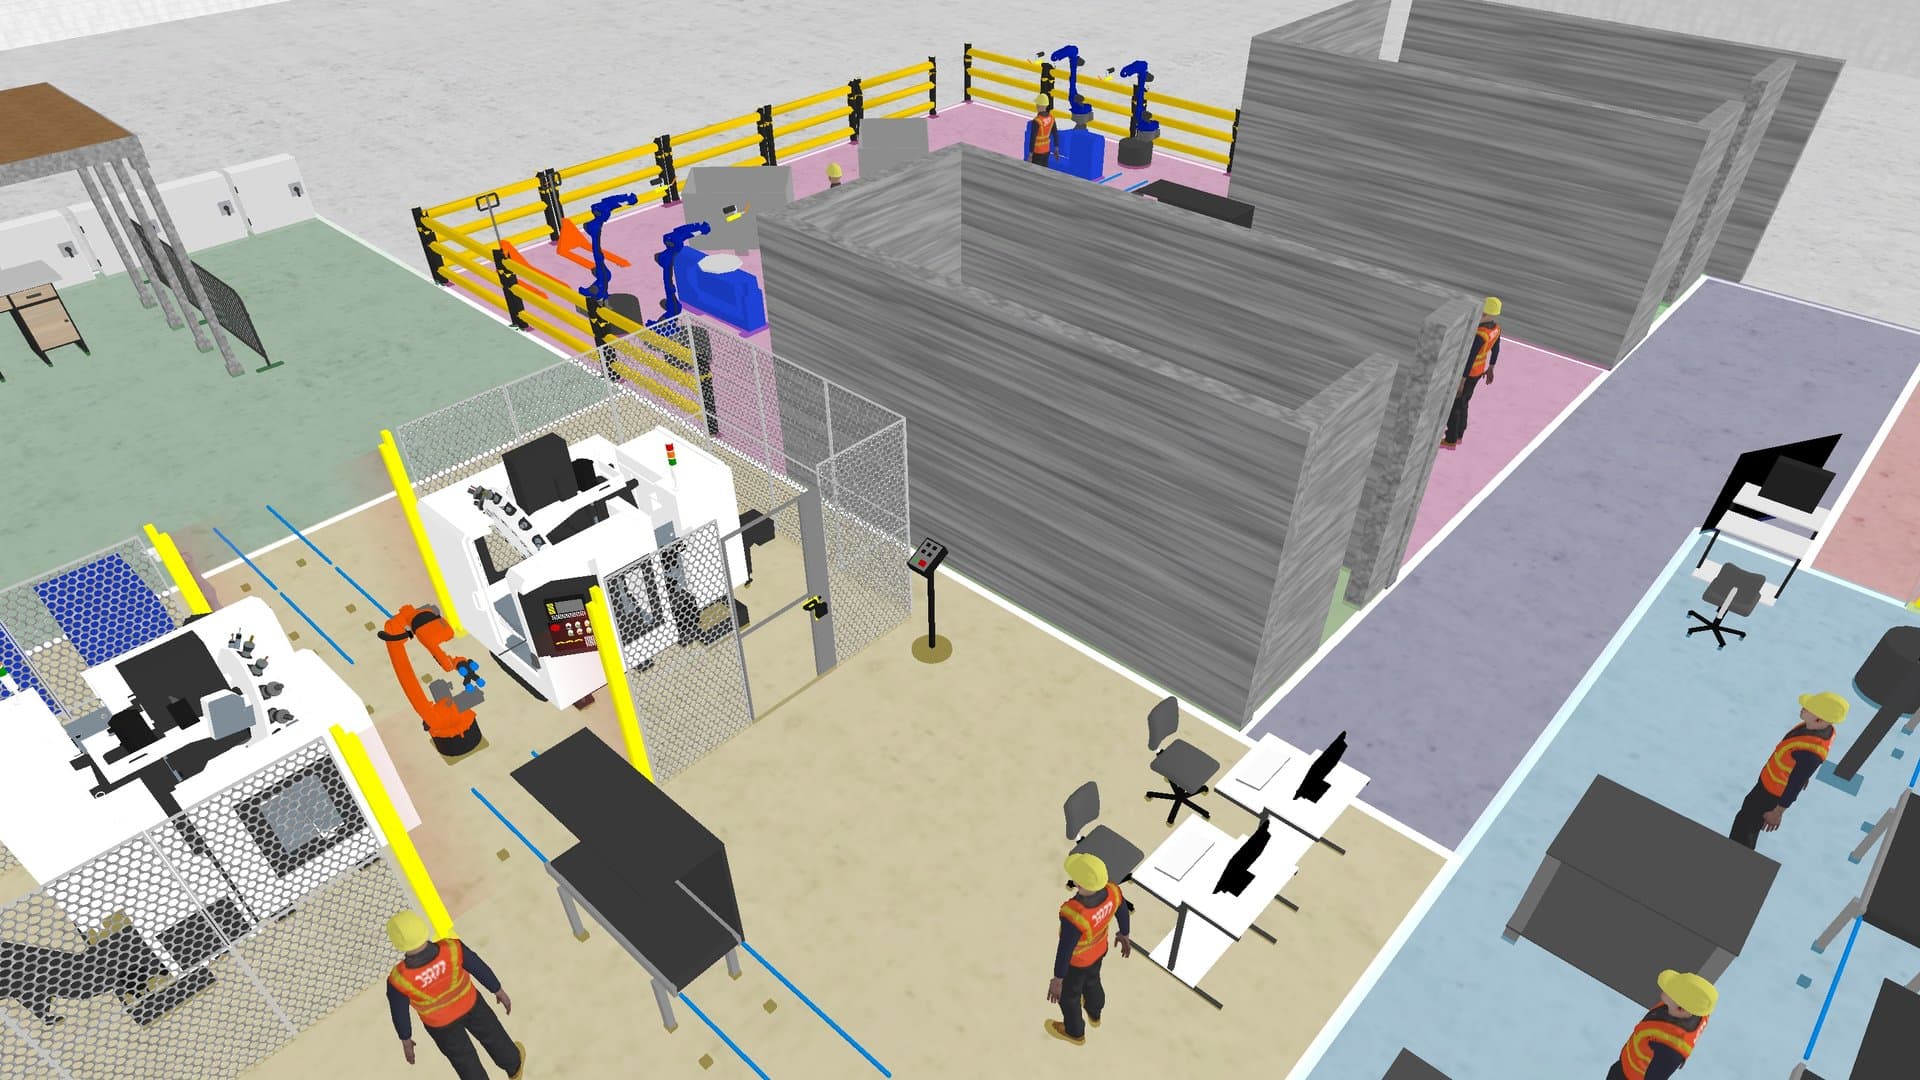
"We have no data" usually means "we have no clean data set"
When a plant says it has no data for a simulation, it rarely means nothing exists. It means the data is spread across a CAD file, an ERP export, a planner's spreadsheet, maintenance notes and the heads of shift leaders. Nobody has put it in one place.
That is normal, and work can start anyway. A simulation needs the numbers that drive time: how long work takes, how long it waits, and how material moves between stations. Collecting those for one area is a matter of days.
The other common blocker is the belief that a model must be connected to machines first. Static data is enough for the first decisions. We explain when a live connection starts to pay in When to Connect a Digital Twin to Live Data.
The minimum data set
A first model needs the data below. Each row also says where it usually lives and how to fill the gap if it is missing.
| Data | Where it usually lives | If it is missing |
|---|---|---|
| Layout of the area | CAD file or PDF drawing | Scaled sketch with measured aisles and station positions |
| Routings: which product goes through which stations | ERP, routing sheets | Walk the flow with a shift leader for each product family |
| Cycle times per station | ERP standard times | Stopwatch on the floor across shifts and operators |
| Changeover times and rules | Planner's spreadsheet, setup sheets | Record a set of real changeovers |
| Stops and breakdowns | Maintenance log, shift reports | Ask operators and maintenance for typical frequency and duration |
| Resources and shifts | HR plan, shift calendar | Shift leader interview |
| Transport: forklifts, carts, speeds, routes | Logistics team, vehicle specs | Measure a few typical trips |
| Order mix | ERP order history | Export a recent typical week and a heavy one |
| Buffers and racks: positions and capacity | Layout, warehouse system | Count on the floor |
Few questions need every row at full detail. A picking study needs routes, picks and order lines in detail and only rough station data. A line layout study needs the opposite.
Ranges, not averages
When you collect data by hand, the rule that matters most is to record the spread of each time along with its average. Queues form when two slow cycles follow each other, when a forklift is busy at the wrong moment, when a changeover runs long. An average hides all of that.
Practical tips for a first collection:
- Time cycles across several shifts and operators, including the slower ones, so the best operator's morning does not set the number.
- Write down the reason for every long cycle, such as missing material, a quality check or a jam. Those reasons often matter more than the cycle itself.
- Separate work from waiting, so that a station waiting for parts half the time shows up in the model as starved.
- Take stops from the maintenance log and shift reports. Rough numbers are fine if they come from the floor.
The model then runs these ranges in stochastic simulation, so bad days appear in the result next to average ones.
Scope the data to one question
Data collection gets out of hand when the scope is "the whole plant". Start from the decision instead: which layout, which picking method, how many carts, which shift pattern. Then draw a boundary around the area that decision affects and write down what is outside it on purpose.
This keeps the data set small and the first result fast. How to Run Your First Simulation Project explains how to set that question, the team and the timing.
Not sure your data is enough?
A list of what you have today is enough to begin, even if it is just an ERP export and a PDF drawing. Share it with the decision you want to test, and we will point out the gaps and the quickest way to fill them on the floor.
A real case: a warehouse model built from production orders
An HVAC manufacturer in Mazovia, central Poland, with over 150 people on two shifts, makes highly customized ventilation and cooling products. The warehouse pick area handles an average of 800 picks per shift with ten people, and picking was hard to plan.
DBR77 built a digital twin of the warehouse section. The inputs were ordinary plant data:
- transport routes in the warehouse
- boundary conditions and operating parameters
- the transport equipment in use
- process data imported in a structured format from current production orders
An algorithm then generated an optimized picking list adapted to the planned daily product mix. Three scenarios were compared:
- Unoptimized, in production-order sequence: about 1000 seconds.
- Island algorithm: about 550 seconds.
- Sorting algorithm: about 200 seconds.
The simulation was prepared in a few days from current production orders. Updating it requires only importing revised production orders, after which the algorithm finds a new solution in seconds. That helps during material or operator shortages. Everything started from production orders the plant already had.
Check the data before you trust the model
Hand-collected data is fine as long as someone checks it. Before comparing variants, run three simple checks:
- Rebuild a known week. Run the current state with a recent order mix. Output and the main queues should look like what the shift leaders remember.
- Check the bottleneck. The station the model shows as the constraint should match where the floor sees the problem.
- Move one input. Make one cycle time longer. The result should change in a direction the team can explain.
Give every assumption that matters an owner, a source and a date. When a number is challenged later, someone can say where it came from.
When machine data starts to help
Live data from DBR77 IoT becomes useful when the model is rerun often and updating it by hand turns into a chore, or when cycle times and stops drift faster than anyone can measure them. Plan it as a later step. If you are preparing for it, see What Data Should You Collect from Machines? on the DBR77 IoT knowledge base.
FAQ
Can we start a simulation with only ERP data?
Often yes, for a first rough model. ERP gives routings, standard times and order history. Check standard times against the floor, because they often differ from real cycles.
How long does it take to collect the data by hand?
It depends on the scope. For one area and one question, it is usually a matter of days. The warehouse case above was ready in a few days from current production orders.
Is a PDF layout good enough, or do we need CAD?
A scaled PDF or a measured sketch is enough to start. A CAD file, when one exists, saves time and adds precision.
What if our data quality is poor?
Use ranges and label uncertain numbers as assumptions. Then check which assumptions change the result. Only those need better data.
Conclusion
Pick one decision and go through the table above row by row, marking what you already have and who owns it. Ask a shift leader to time the main stations across different shifts while someone exports a recent typical week and a heavy one from ERP. Once those are in, rebuild a known week before you compare any variant.
See what a model built from your data shows
Layout, routings and order history are the inputs. The demo shows the model DBR77 Digital Twin builds from them and how it puts variants next to each other.
Sources
- DBR77, Case study: Retrieving material from the warehouse
- DBR77 IoT, What Data Should You Collect from Machines?
- DBR77 Digital Twin, Deterministic vs stochastic simulation
Want to test a decision from your plant?
Book a demo and we will show how DBR77 Digital Twin compares the options on output, waiting time and transport load.