Use cases for long-term, decision-grade Digital Twins.
Wherever material and people flow through space, decisions can be modeled, simulated, and improved. Filter by area, goal, and maturity stage.
Browse
Filter and explore
Each use-case page includes pains, outcomes, deliverables, and recommended capabilities.
Showing 6 use cases
production
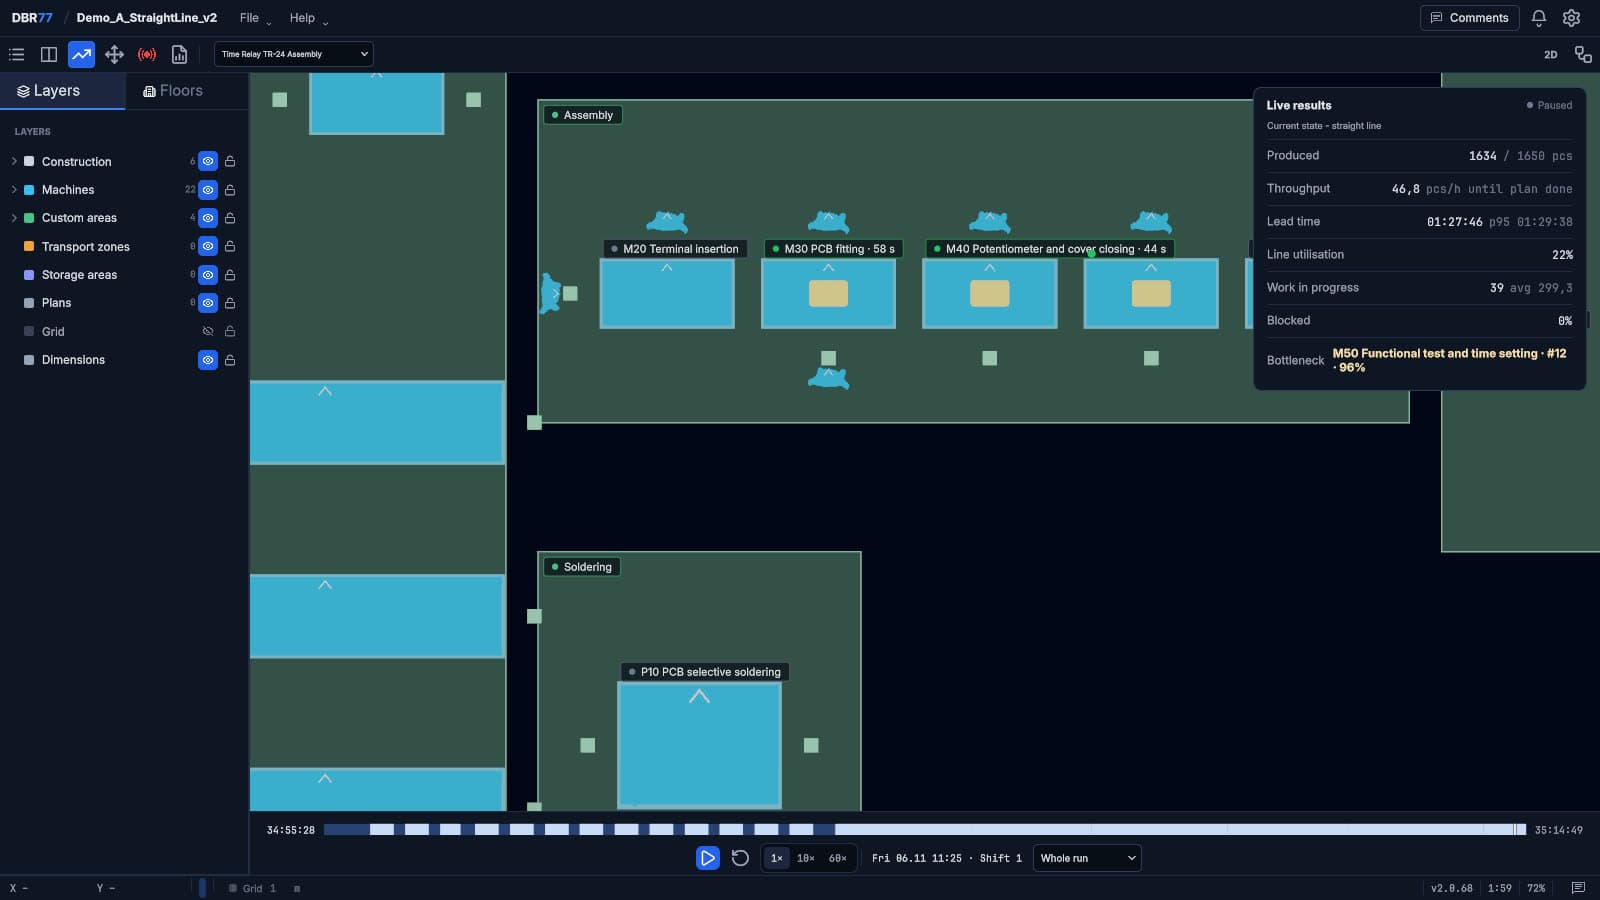
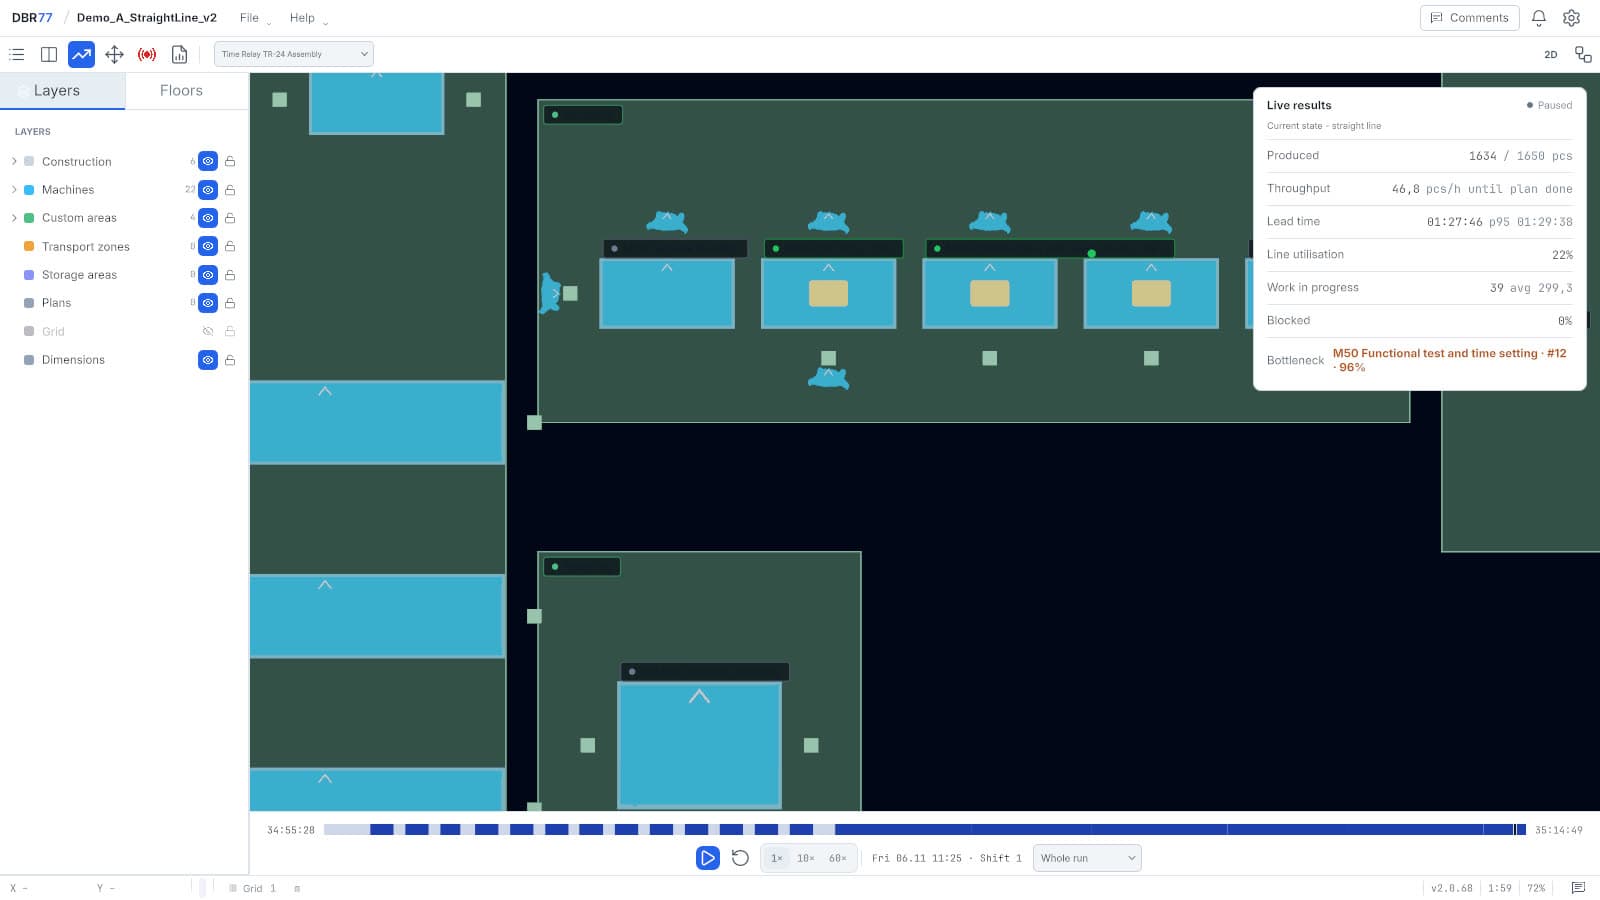
New facility or major expansion (Greenfield)
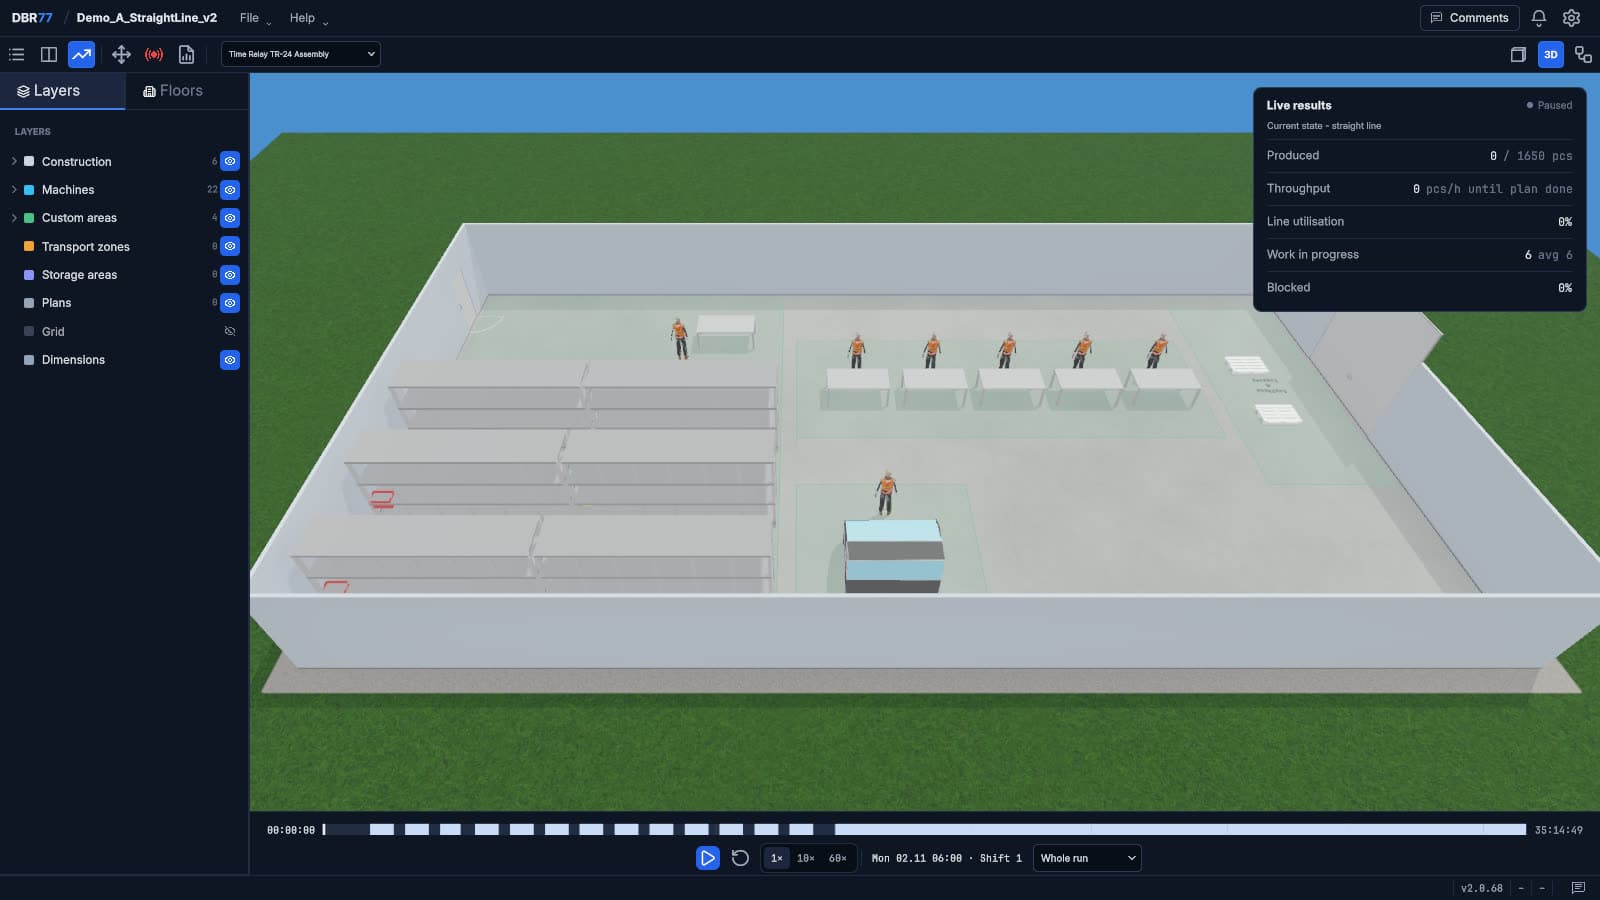
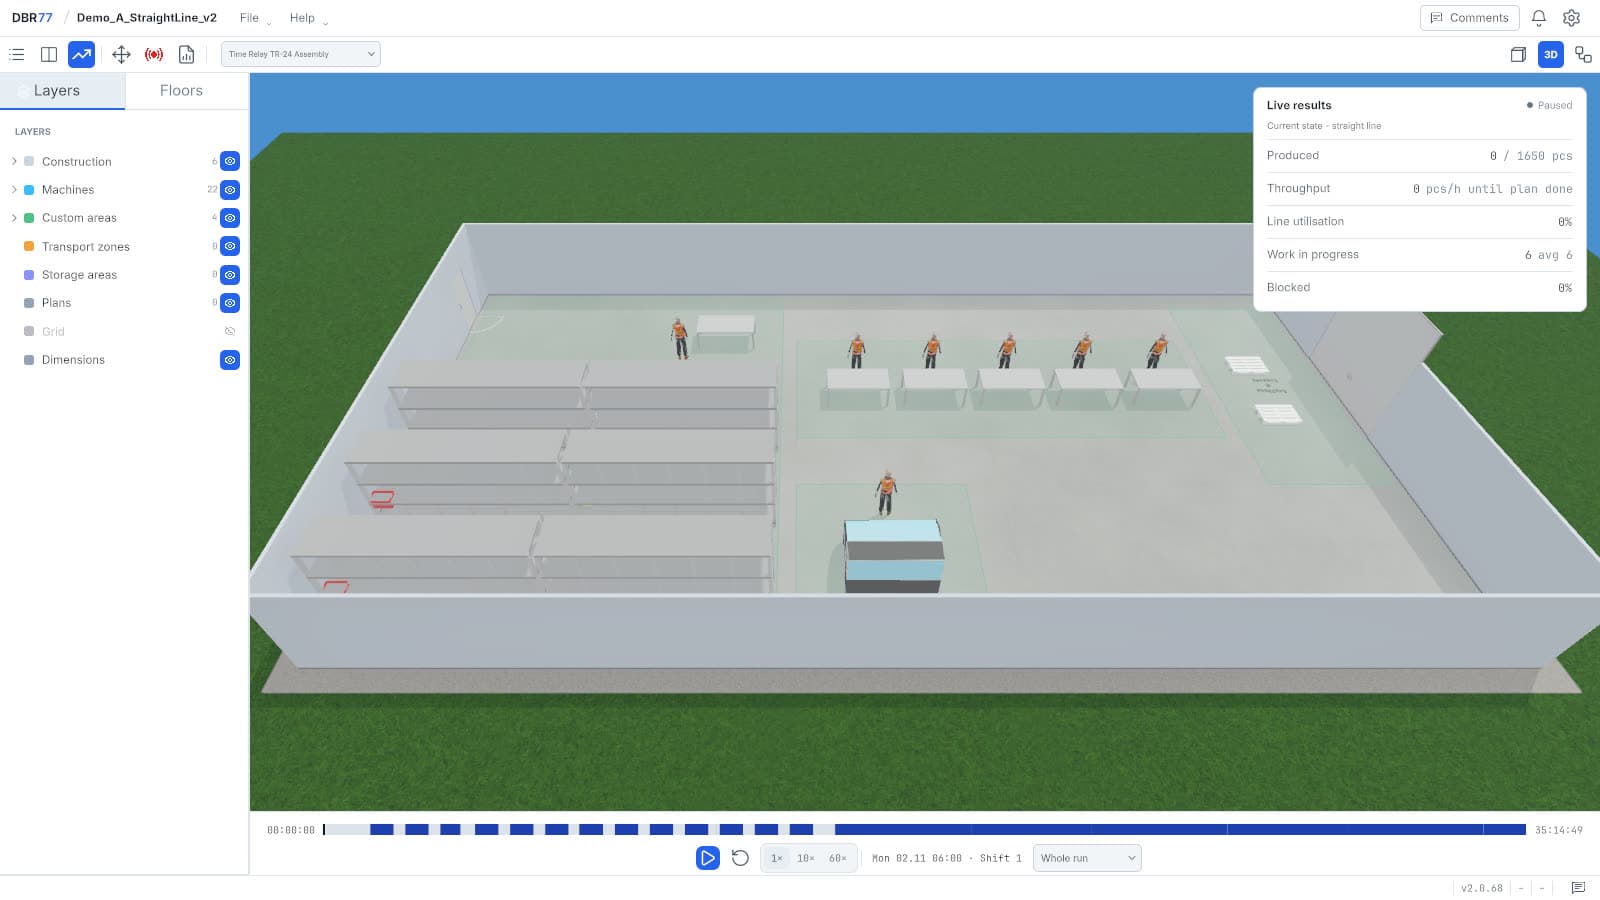
Compare layout variants faster than static CAD and validate scale, flow, and constraints before CAPEX is committed.
production
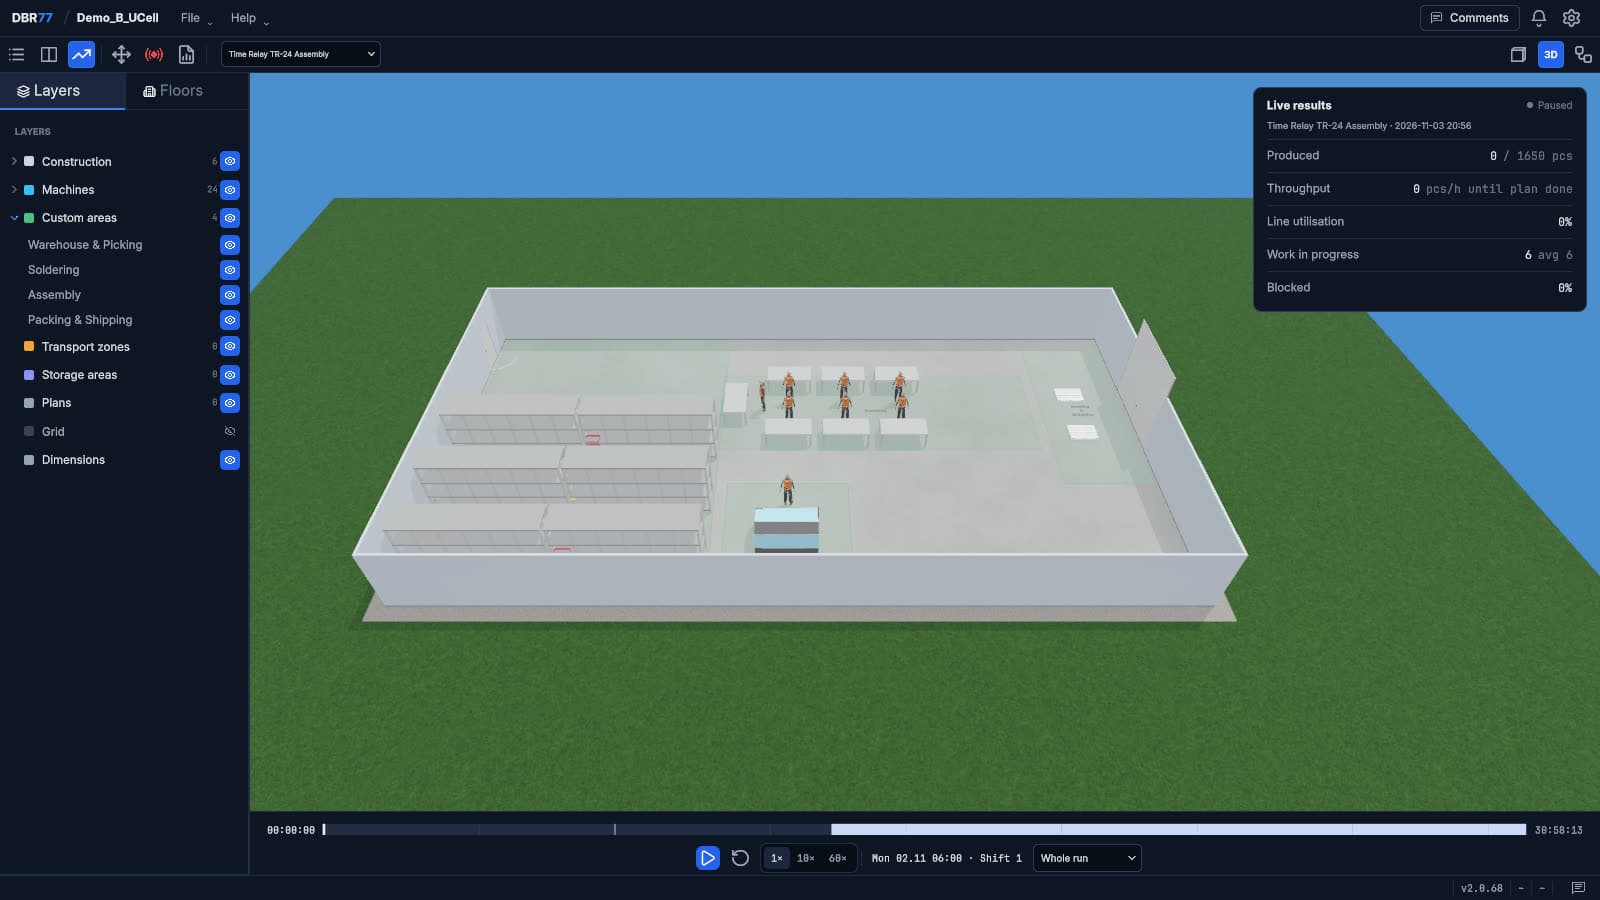
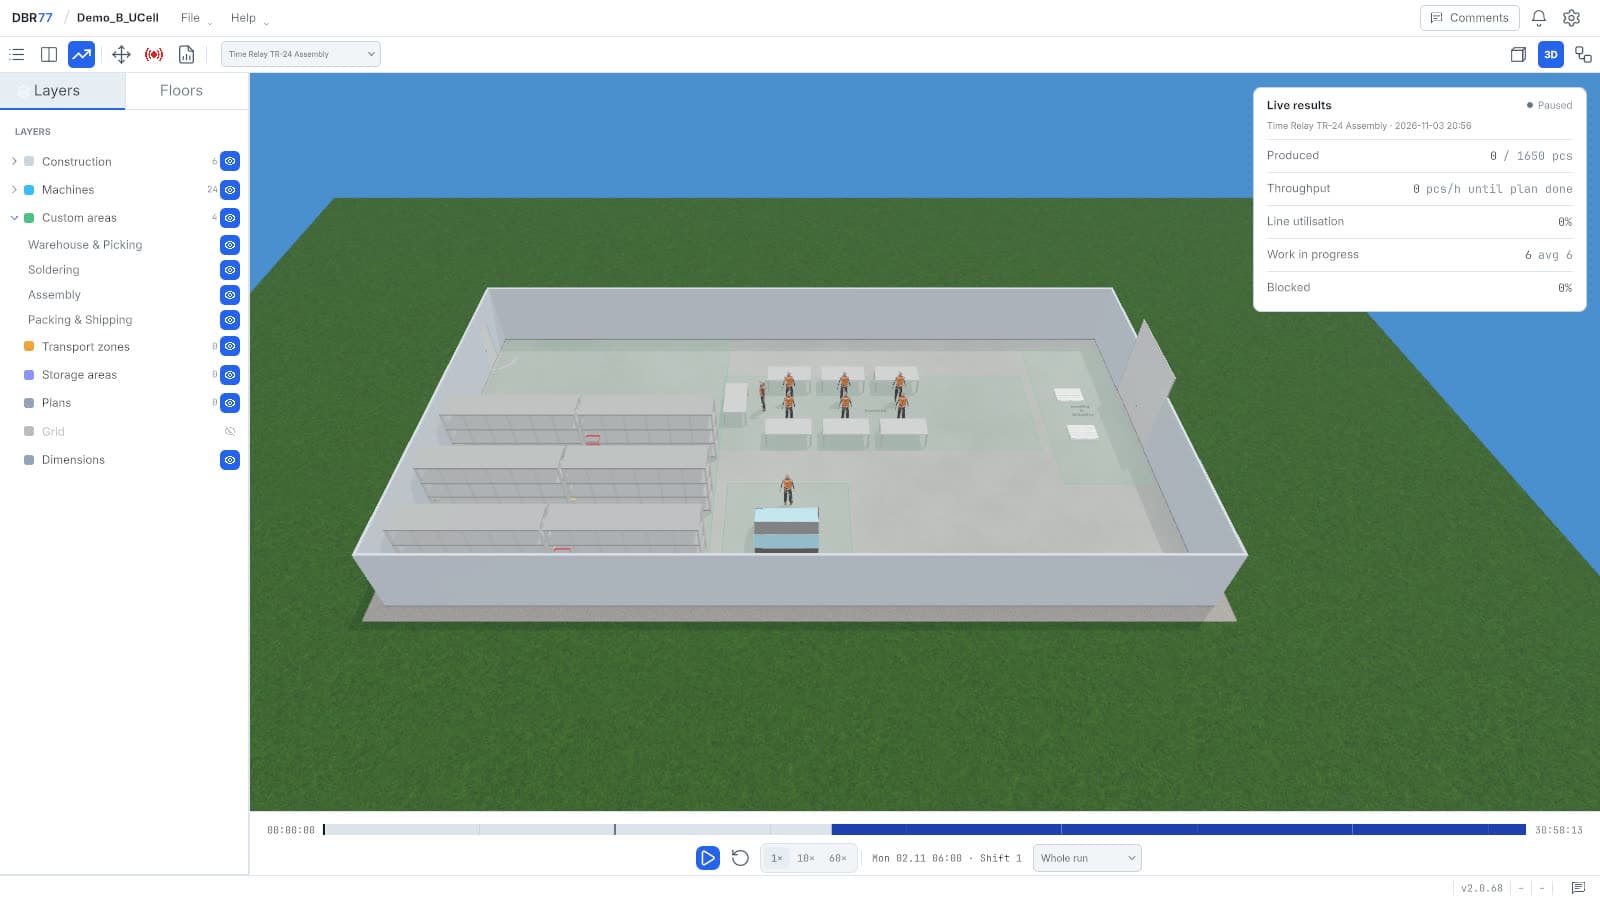
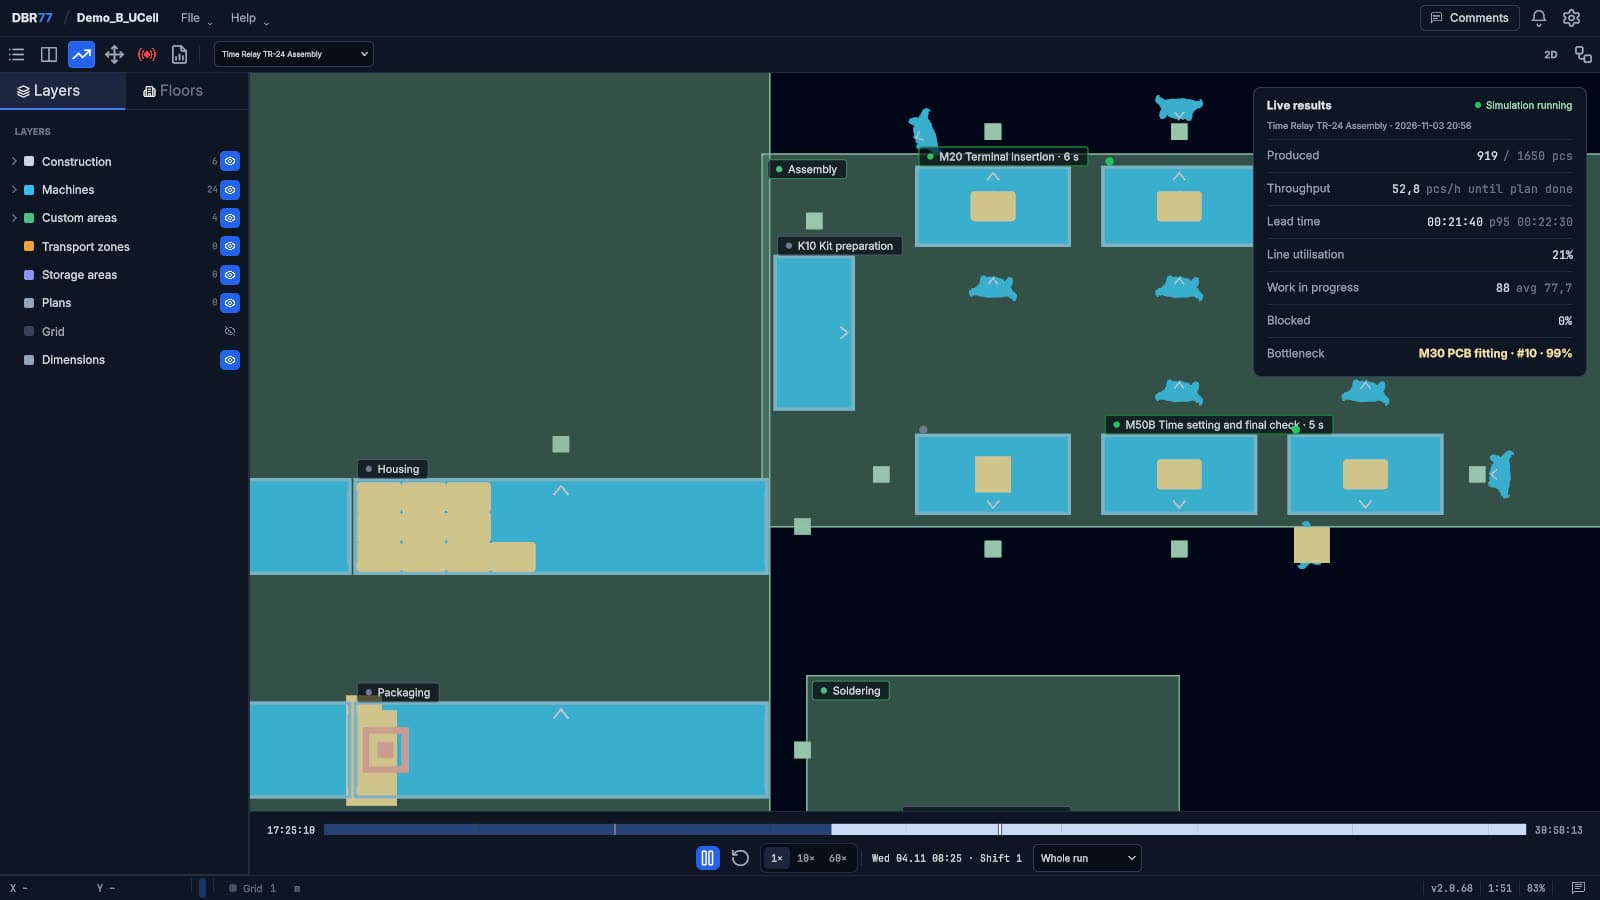
Layout change, relocation, or line rebuild
Plan the sequence of moves and validate constraints so you can execute changes with minimal downtime and stable delivery.
logistics
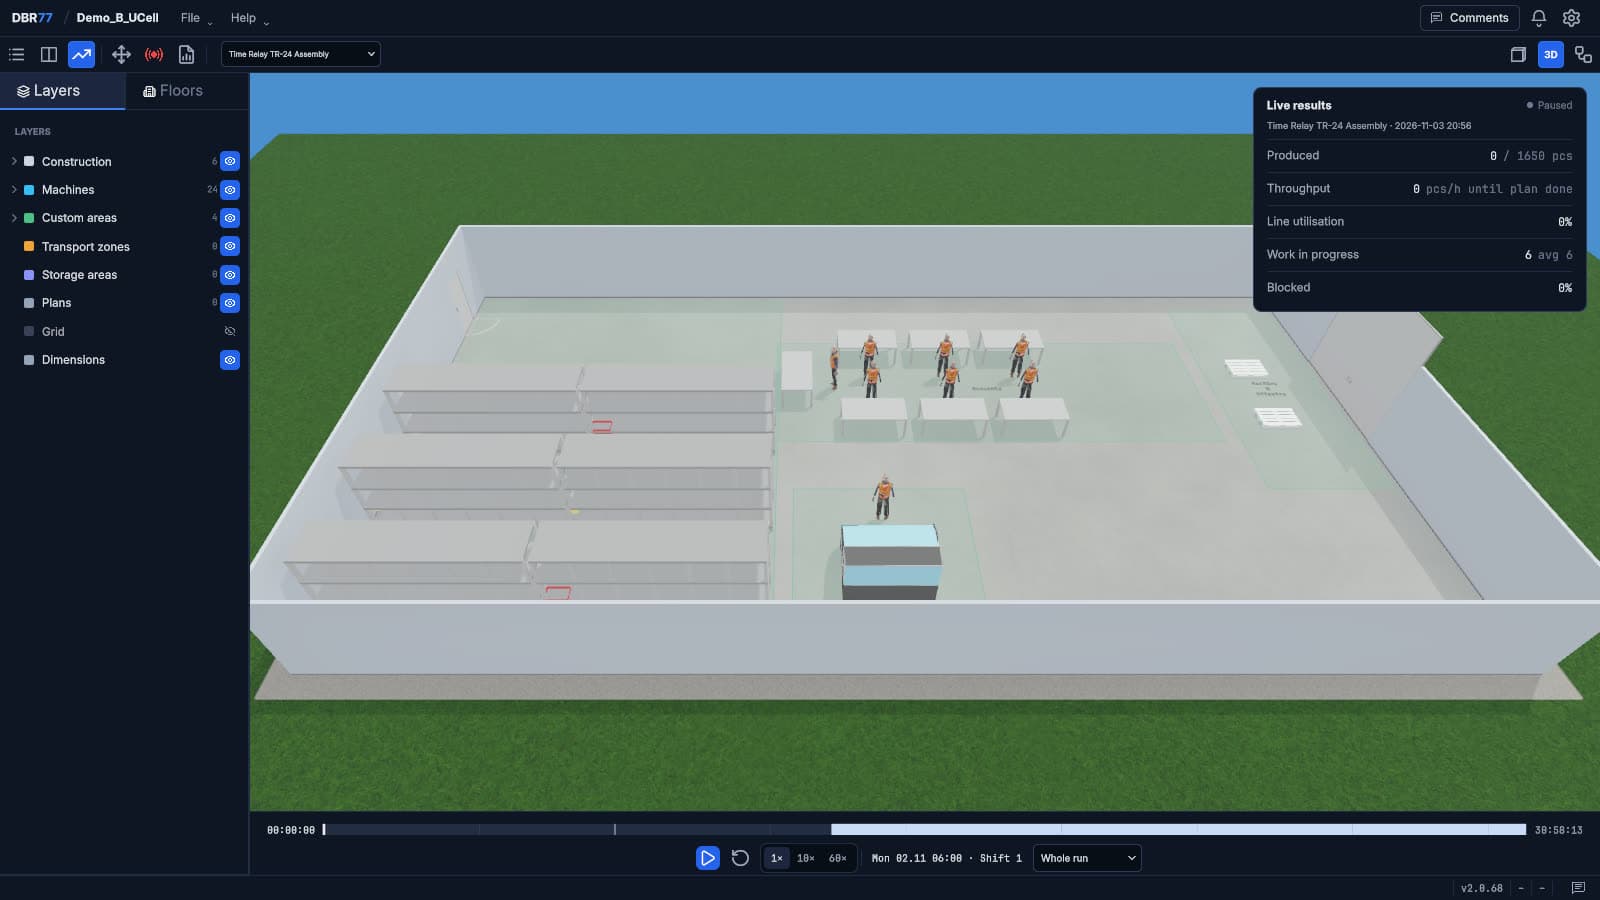
Intralogistics (Milkrun + Kanban)
Simulate replenishment and routes on your layout and production plan, then compare variants when constraints change.
logistics
Warehouse throughput and slotting optimization
Simulate warehouse operations to find bottlenecks, validate slotting, and compare process rules.
production
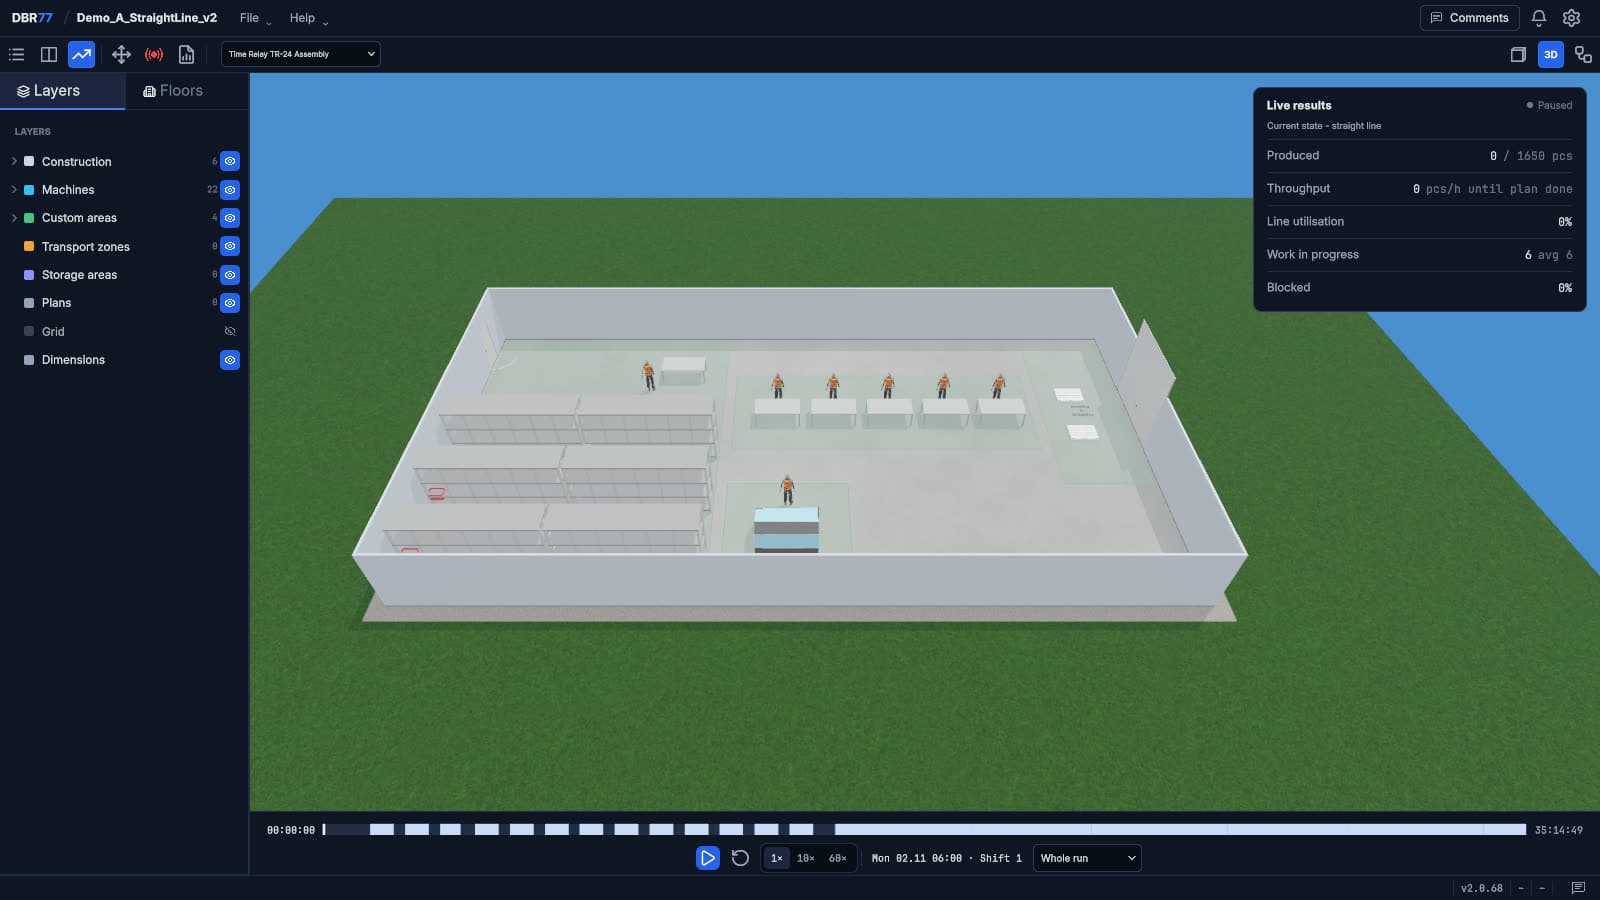
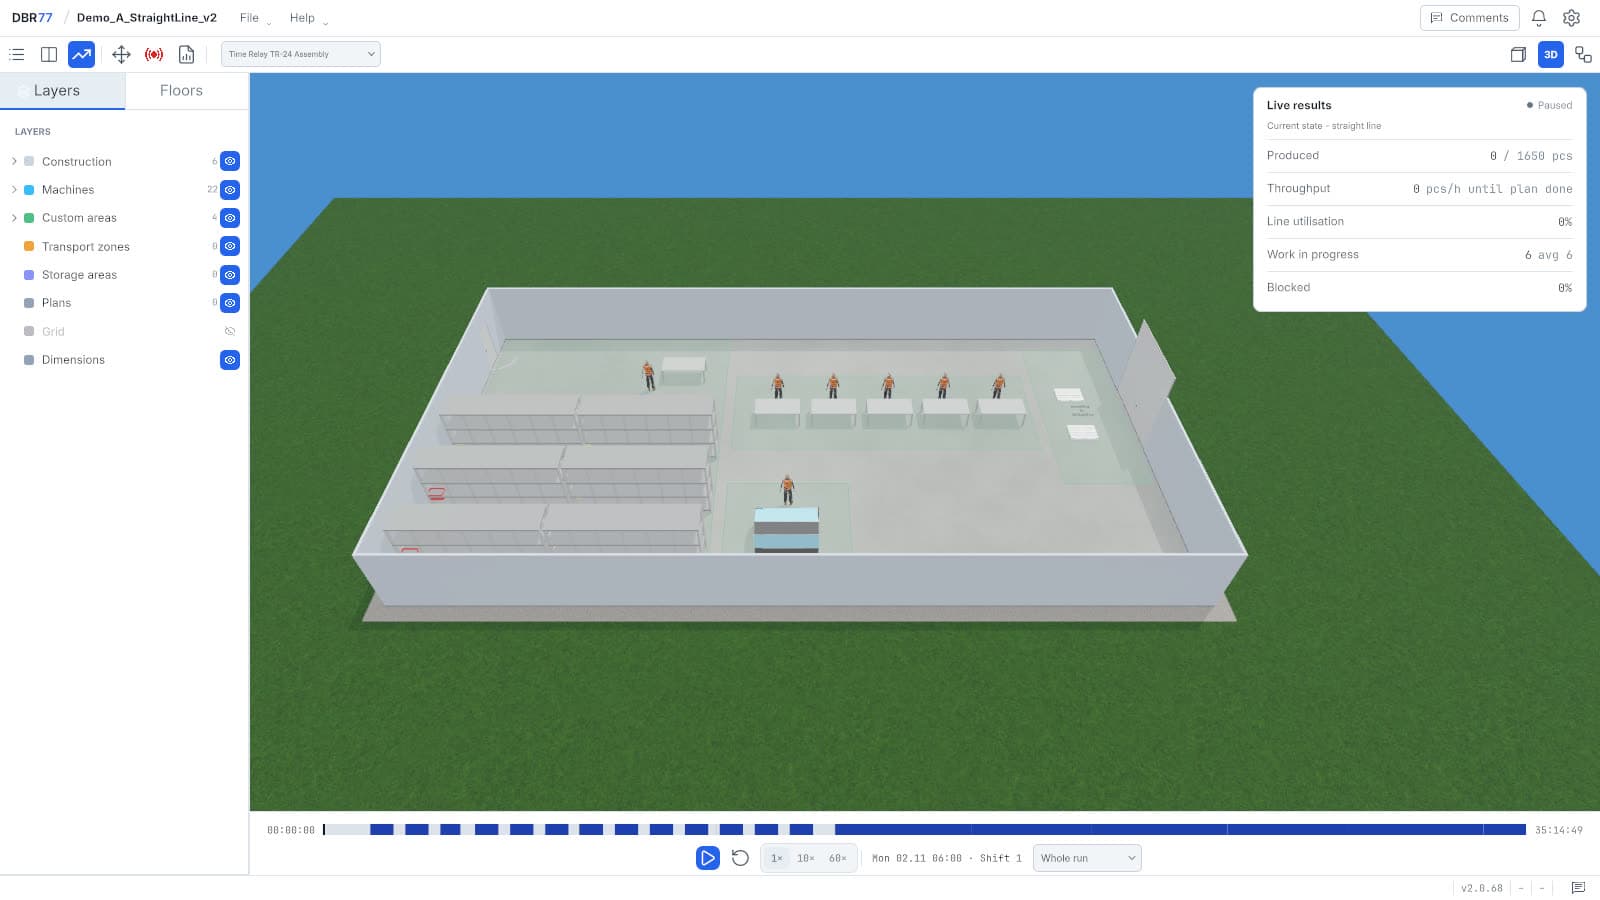
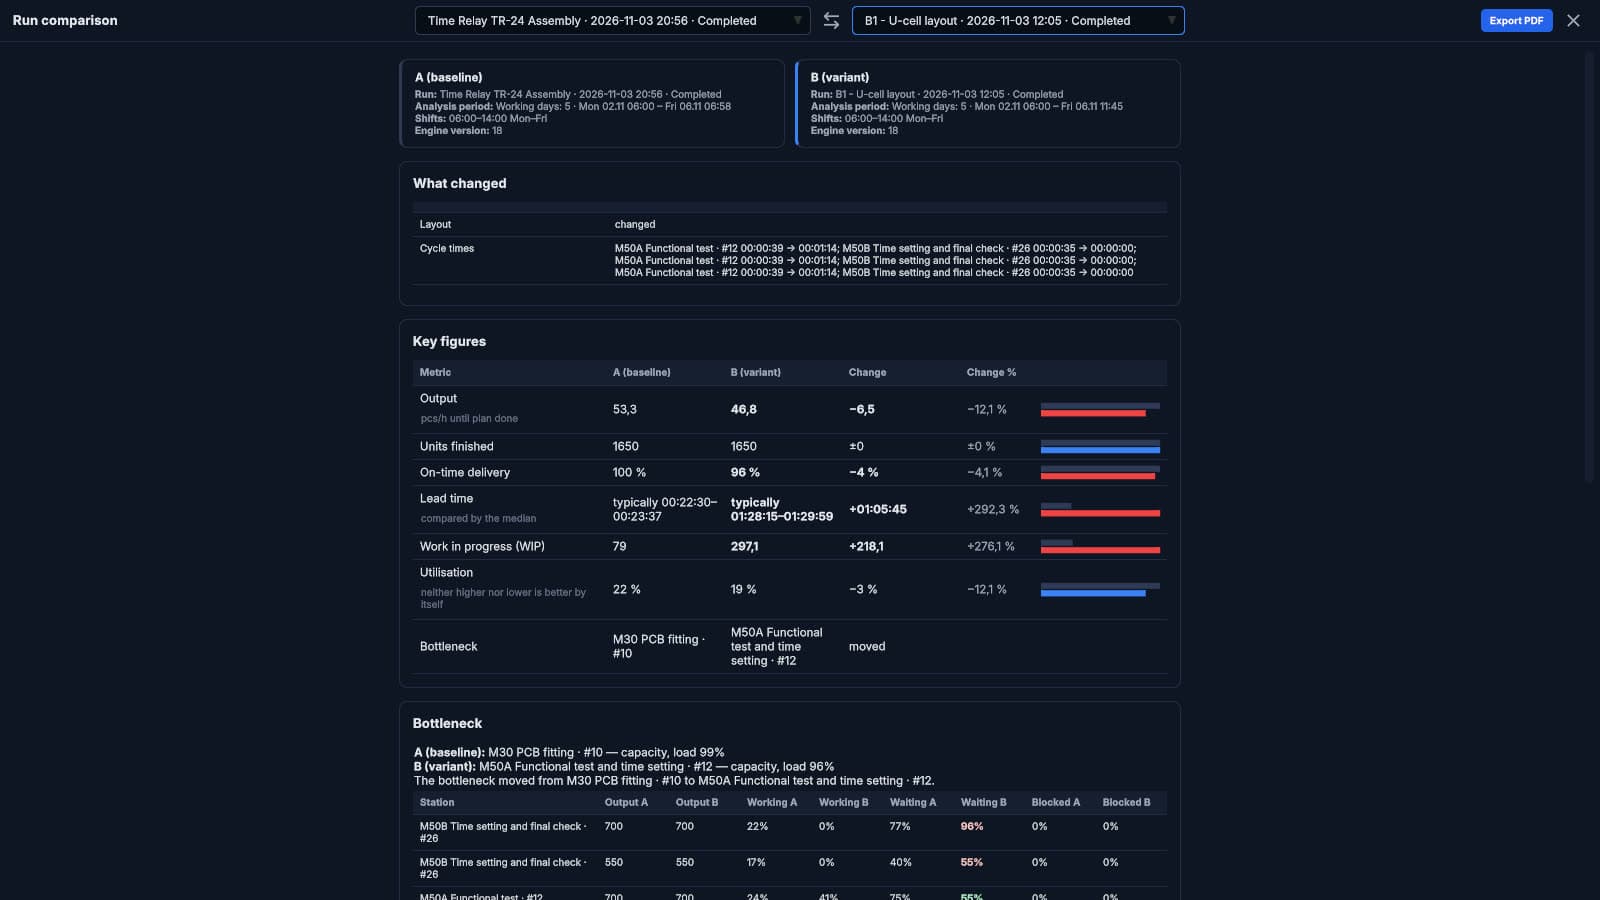
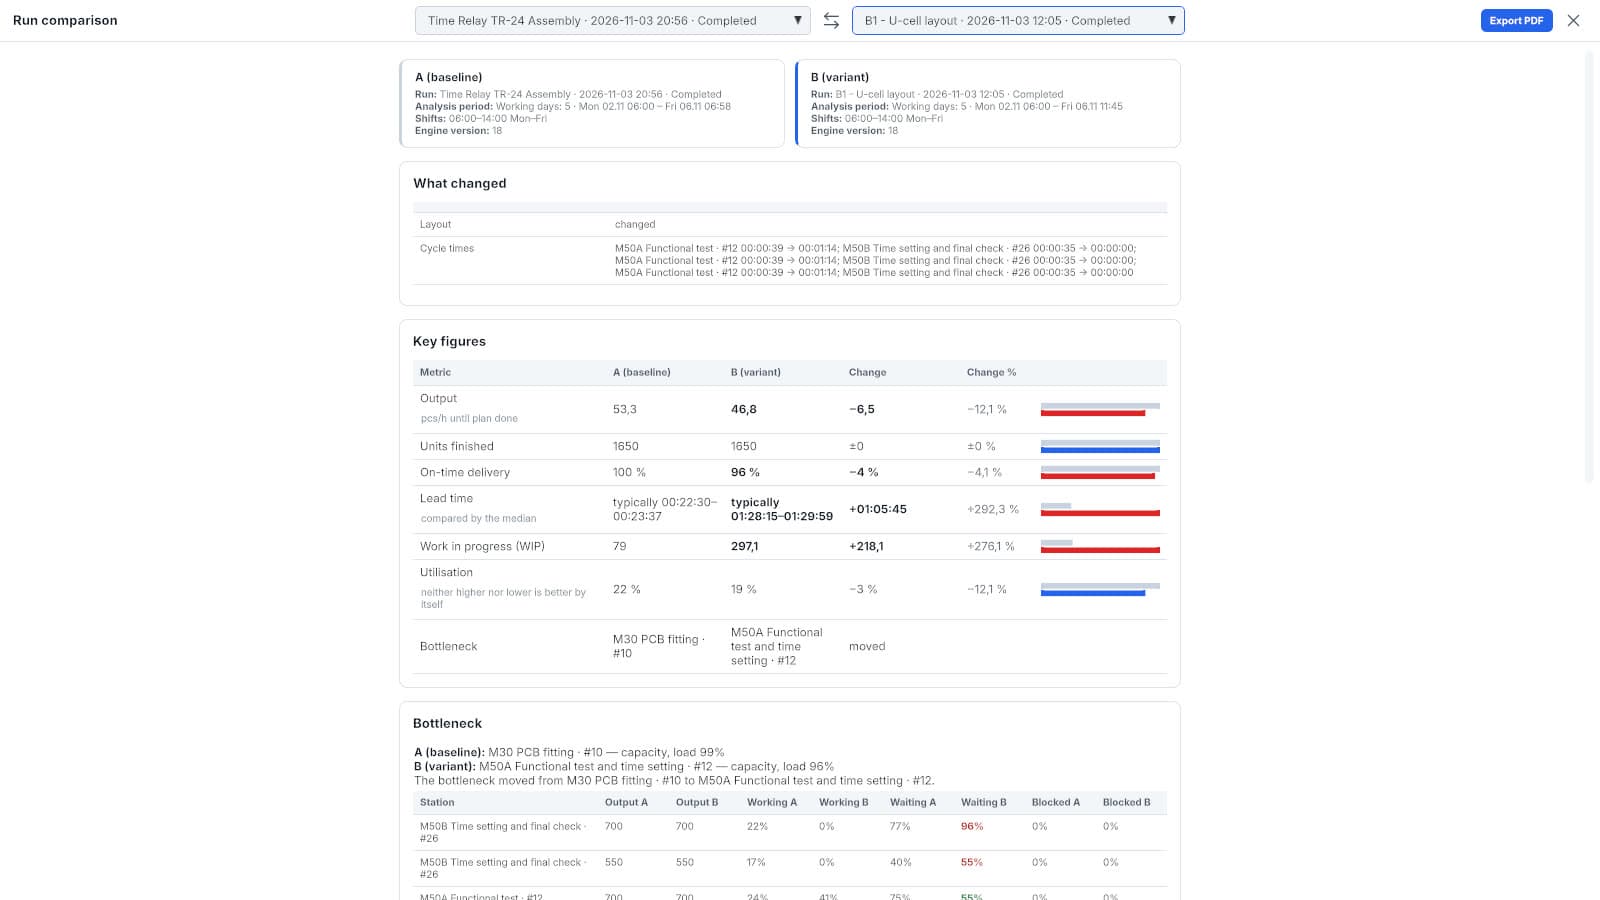
Line balancing and flow decisions
Simulate the week on your routings, shifts and buffers to see which change protects throughput and on-time delivery.
suppliers
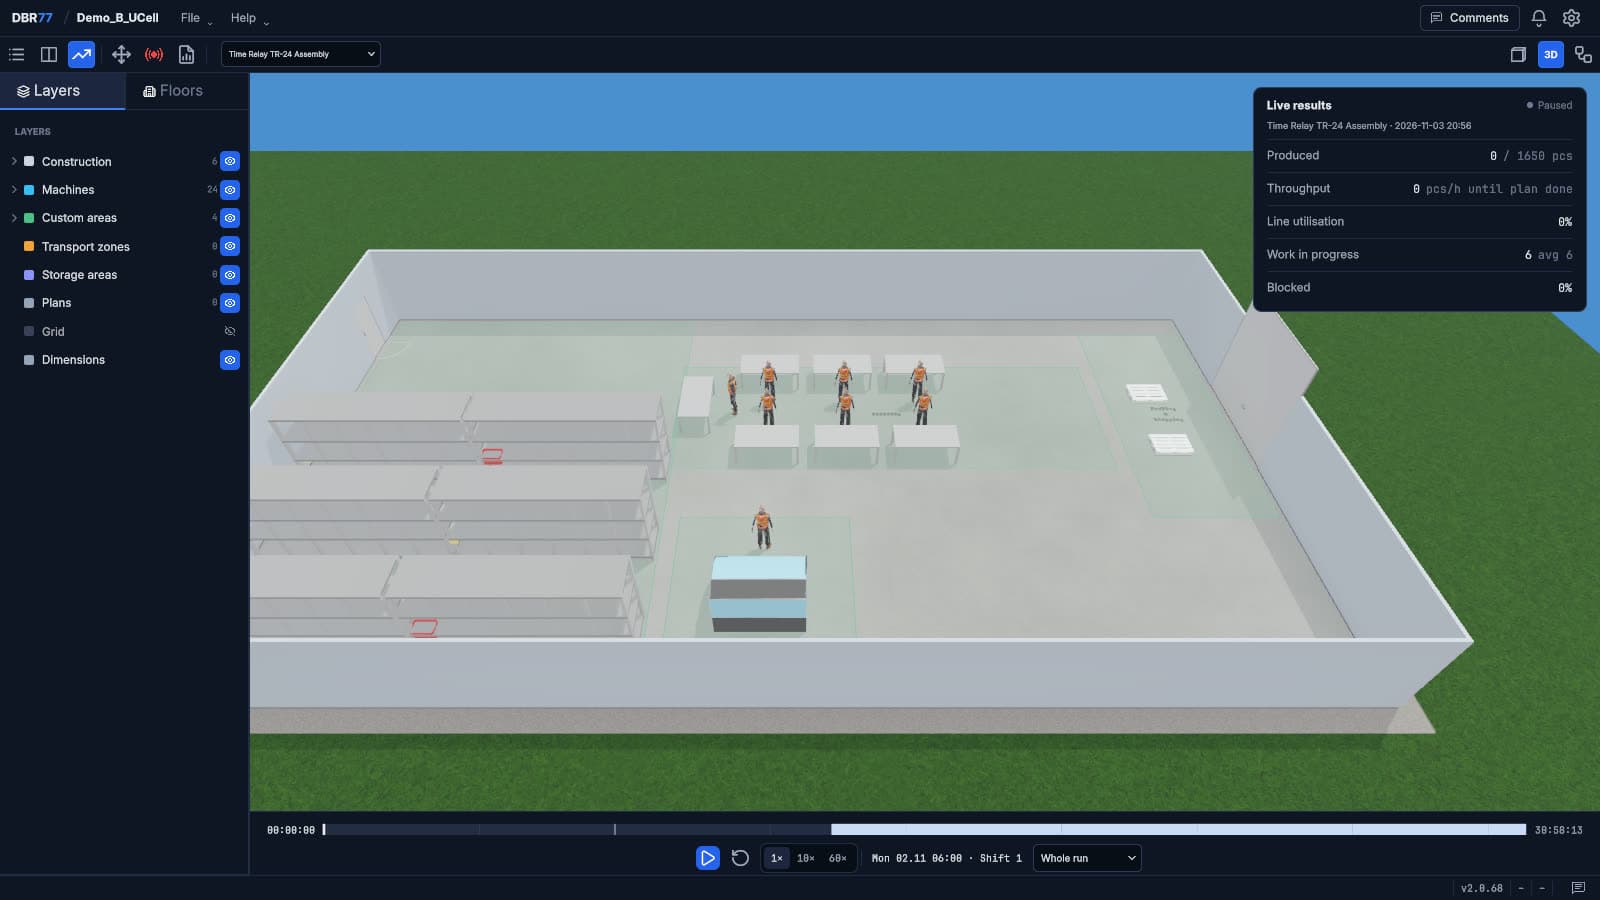
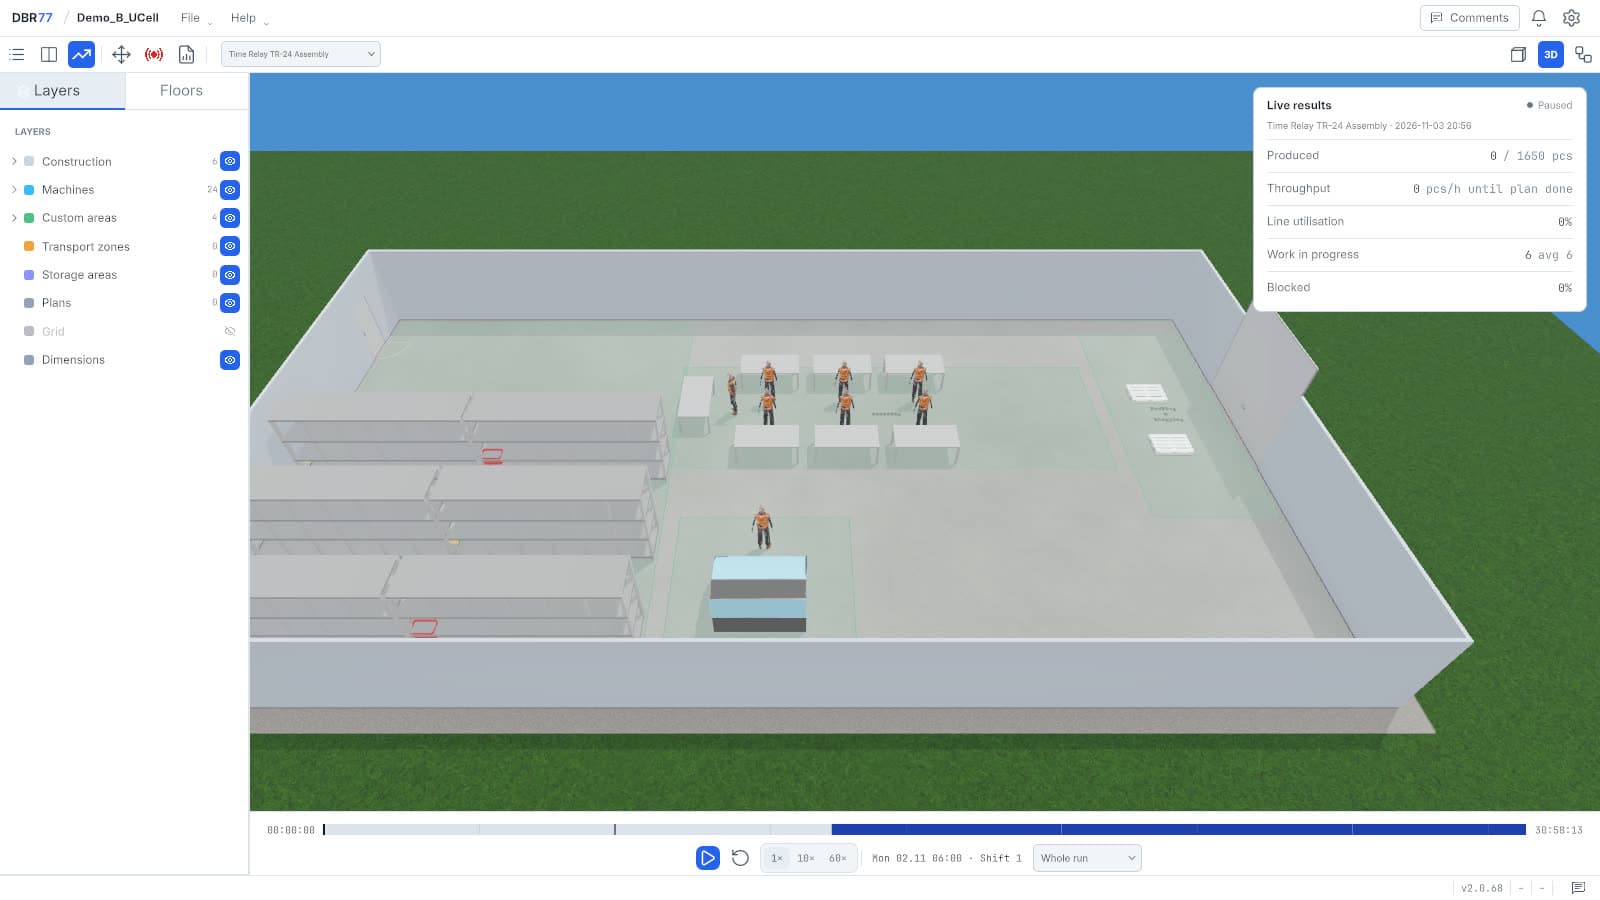
Supplier presales: interactive showroom for complex tech
Create immersive demos that help customers understand constraints, customization, and ROI faster.
Projects
Six published projects
Each case study describes the plant, the task, the work done and the results.
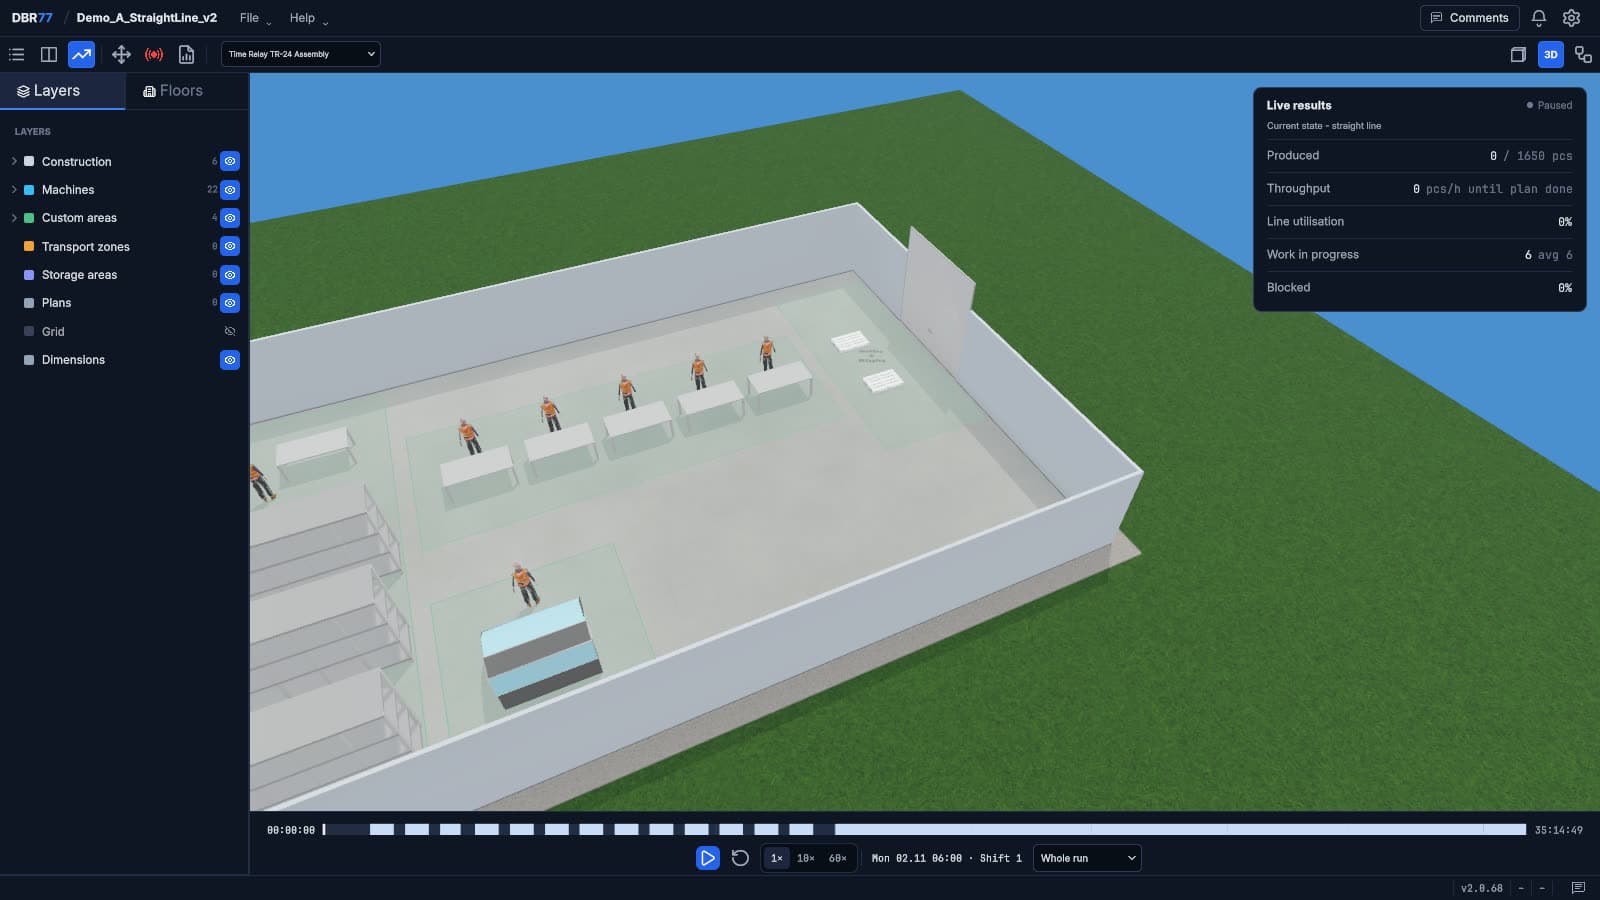
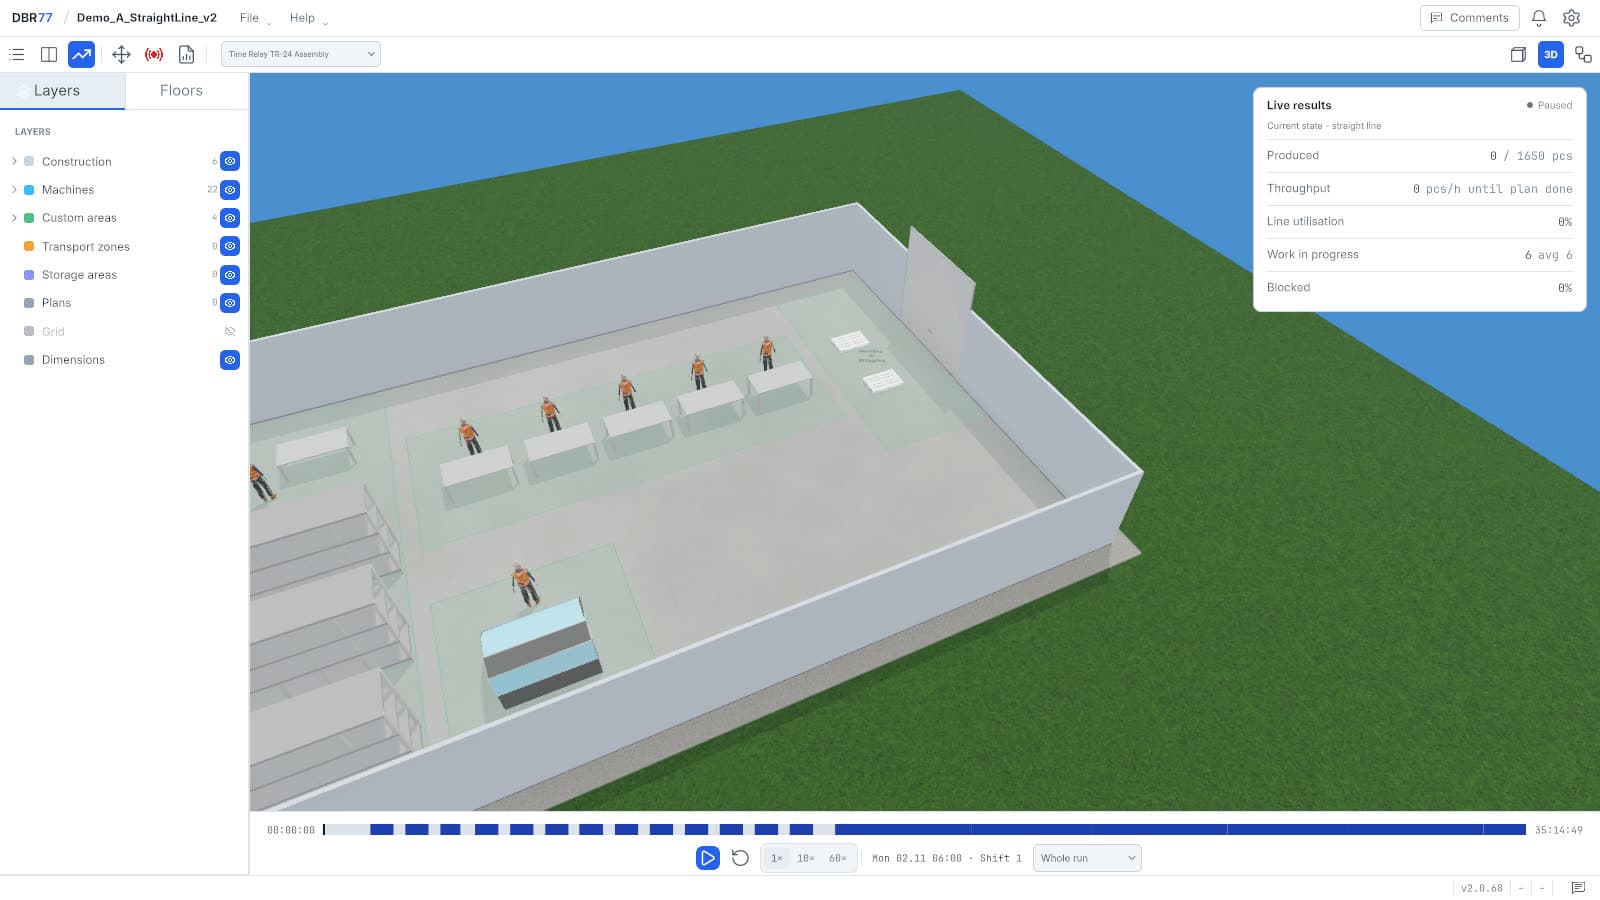
Car lamp manufacturer, southern Poland
Production line design: 6% more output per day
A plant that makes lamps for passenger cars, with 270 people on two shifts. Its processes are injection molding, painting, electroplating, assembly, labeling, quality control and packaging. The building has 28,000 m² and the warehouse 12,000 m².
Results
- The best layout placed the buffer warehouse in the middle, between production and assembly.
- Its average material flow time was not the shortest, but daily output was on average 6% higher than in a linear layout without an intermediate warehouse.
Benefits
- A multi-variant analysis of the line before any change on the floor.
- The analysis covered both material flow and production capacity for the planned order mix.
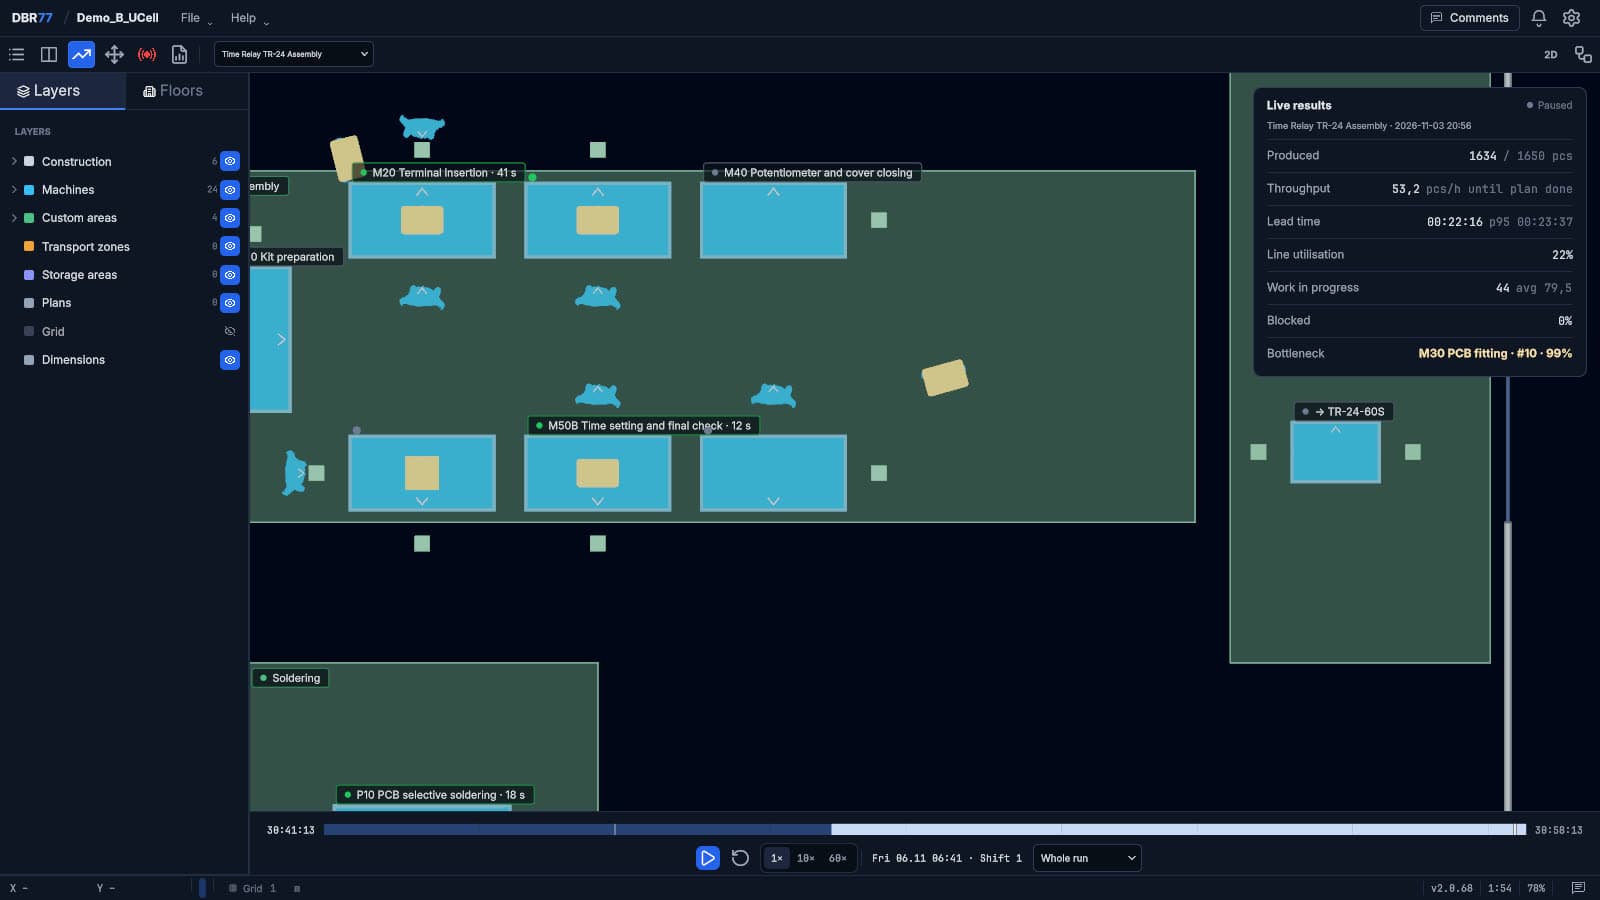
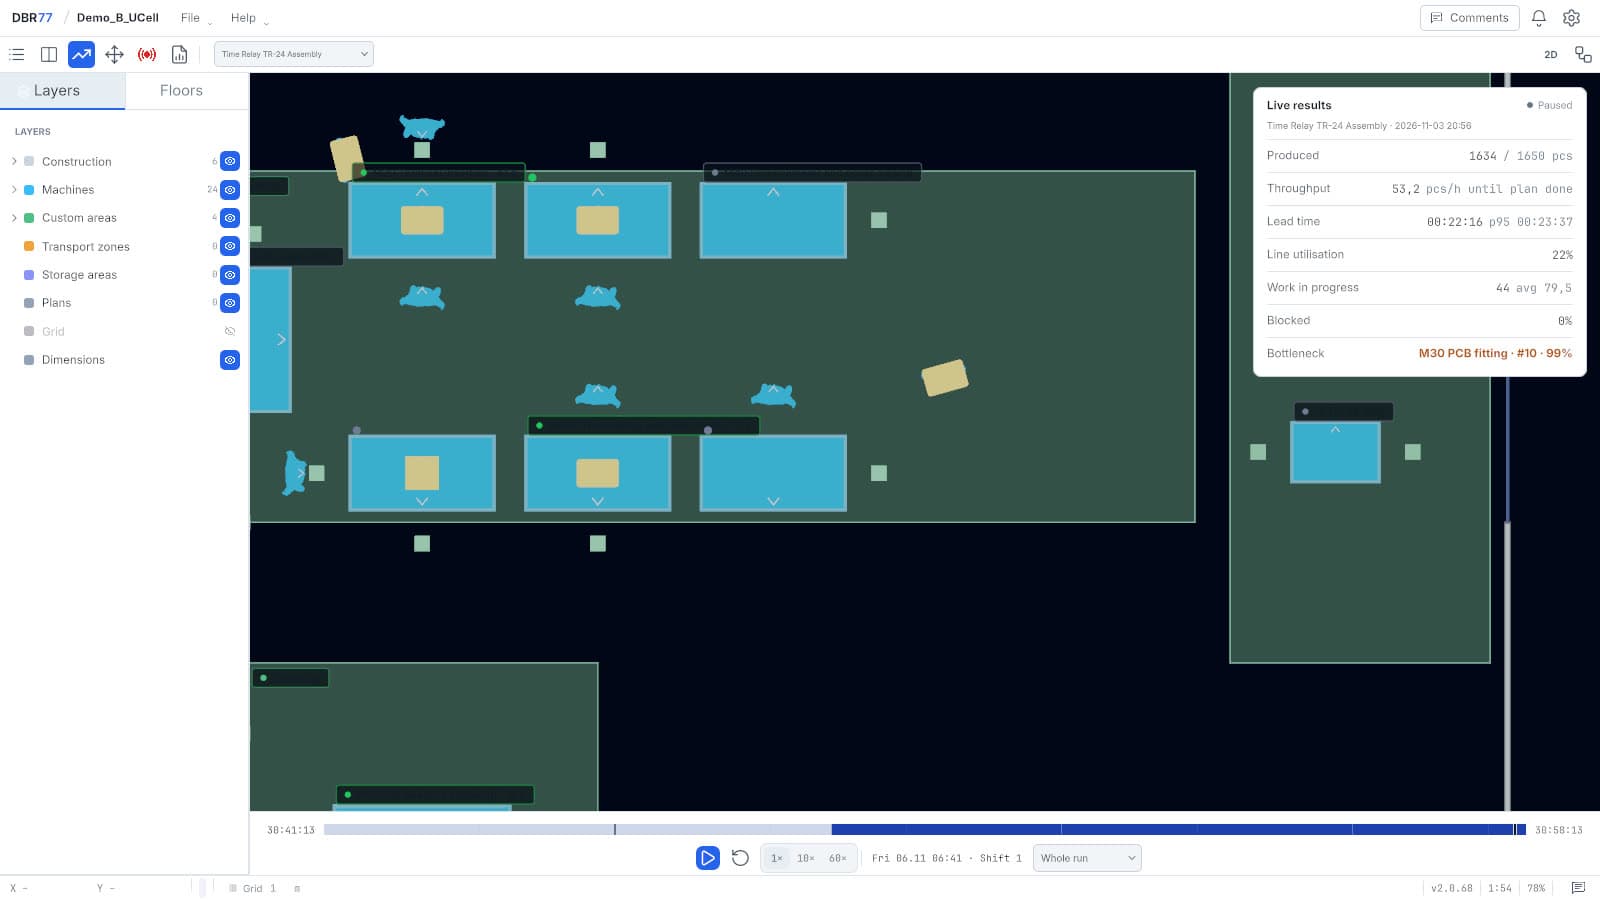
Car lamp manufacturer, southern Poland
Plant expansion: moving machines without stopping production
The same car lamp plant as in the production line case: 270 people on two shifts, a 28,000 m² building and a 12,000 m² warehouse. A new production hall was added to the plant.
Results
- A plan that keeps production at the required level during the expansion.
- The main question was where the storage areas between processes should be and how large they should be.
Benefits
- An order of machine moves that runs processes in parallel.
- The final machine layout changed compared with the starting assumption.
Wooden furniture manufacturer
Layout optimization: 14% lower department costs
A mid-size maker of high-quality wooden furniture, on the market for over 20 years. Raw wood is cut on a circular saw, machined on CNC machines and assembled by hand at assembly stations, with quality checks throughout.
Results
- Working capital went down by PLN 300,000 after the buffer was removed.
- Department costs went down by 14%.
Benefits
- Mapping the production area was the longer step. The AI-supported optimization steps after that took seconds.
- The company can adapt faster when market requirements change.
Ventilation and cooling equipment manufacturer, Mazovia, Poland
Material retrieval from the warehouse: up to 60% less time
A plant with over 150 people on two shifts. The products are highly customized, which makes picking complex. The warehouse makes on average 800 picks per shift, and 10 people work in the analyzed picking area.
Results
- Three states were simulated: picking in the order of the production orders, without optimization (1,000 s), with an island algorithm (550 s) and with a sorting algorithm (200 s).
- The case study reports that the optimization can reduce the time of the original process by up to 60%.
Benefits
- The picking simulation covered the current production orders.
- After a change in the plan, the updated production order is imported and the algorithm finds the new pick list in seconds.
Plastic injection molding for household appliances, central Poland
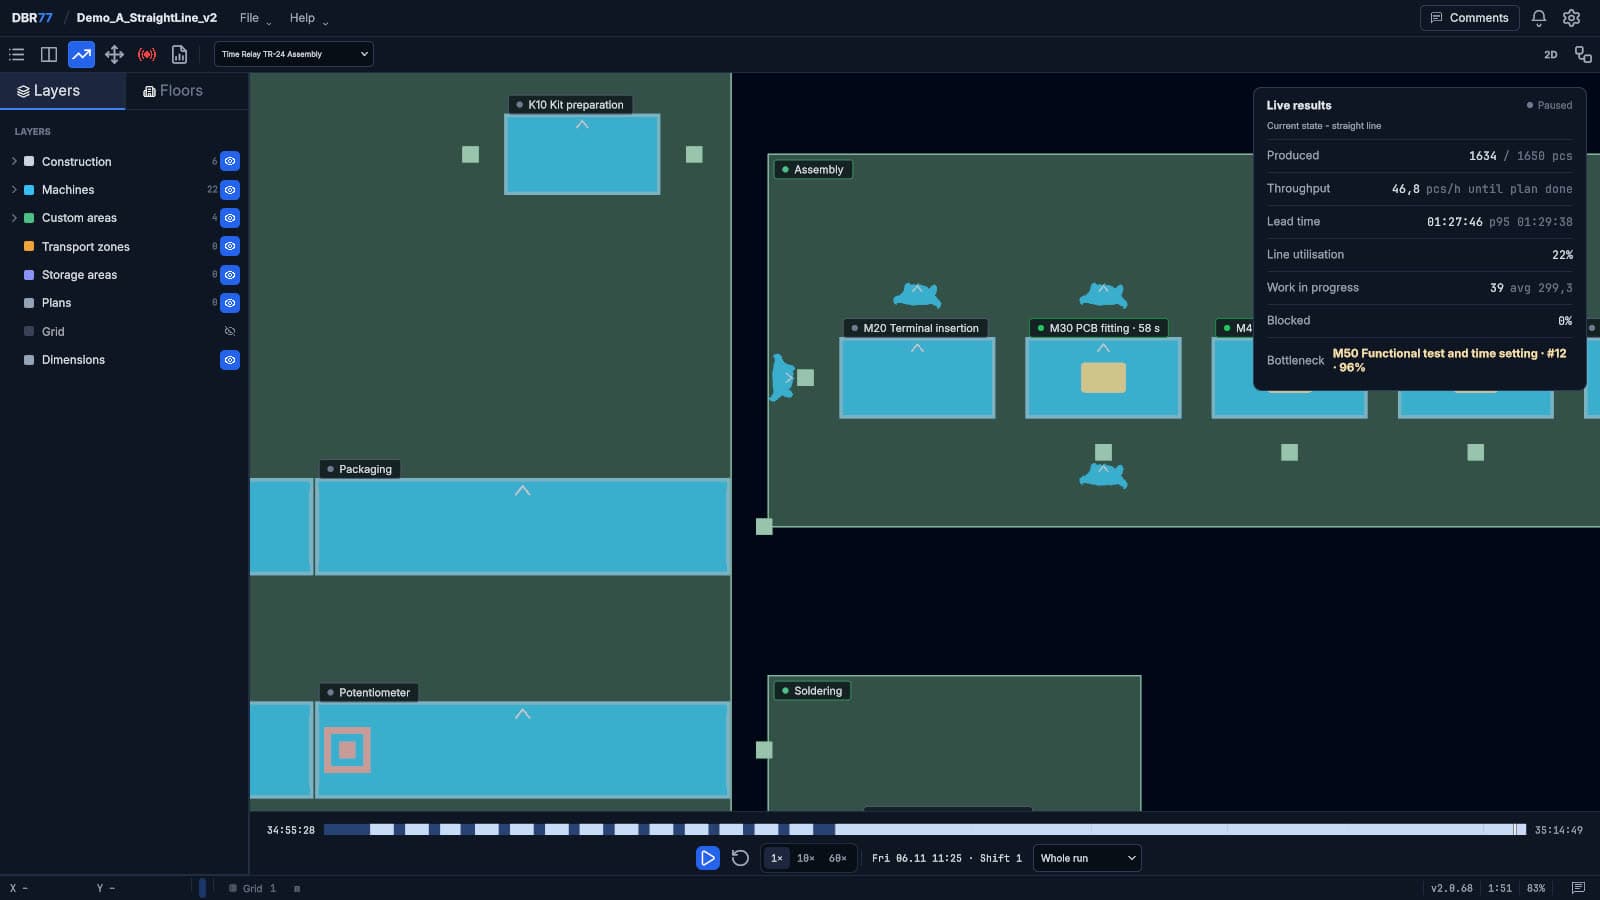
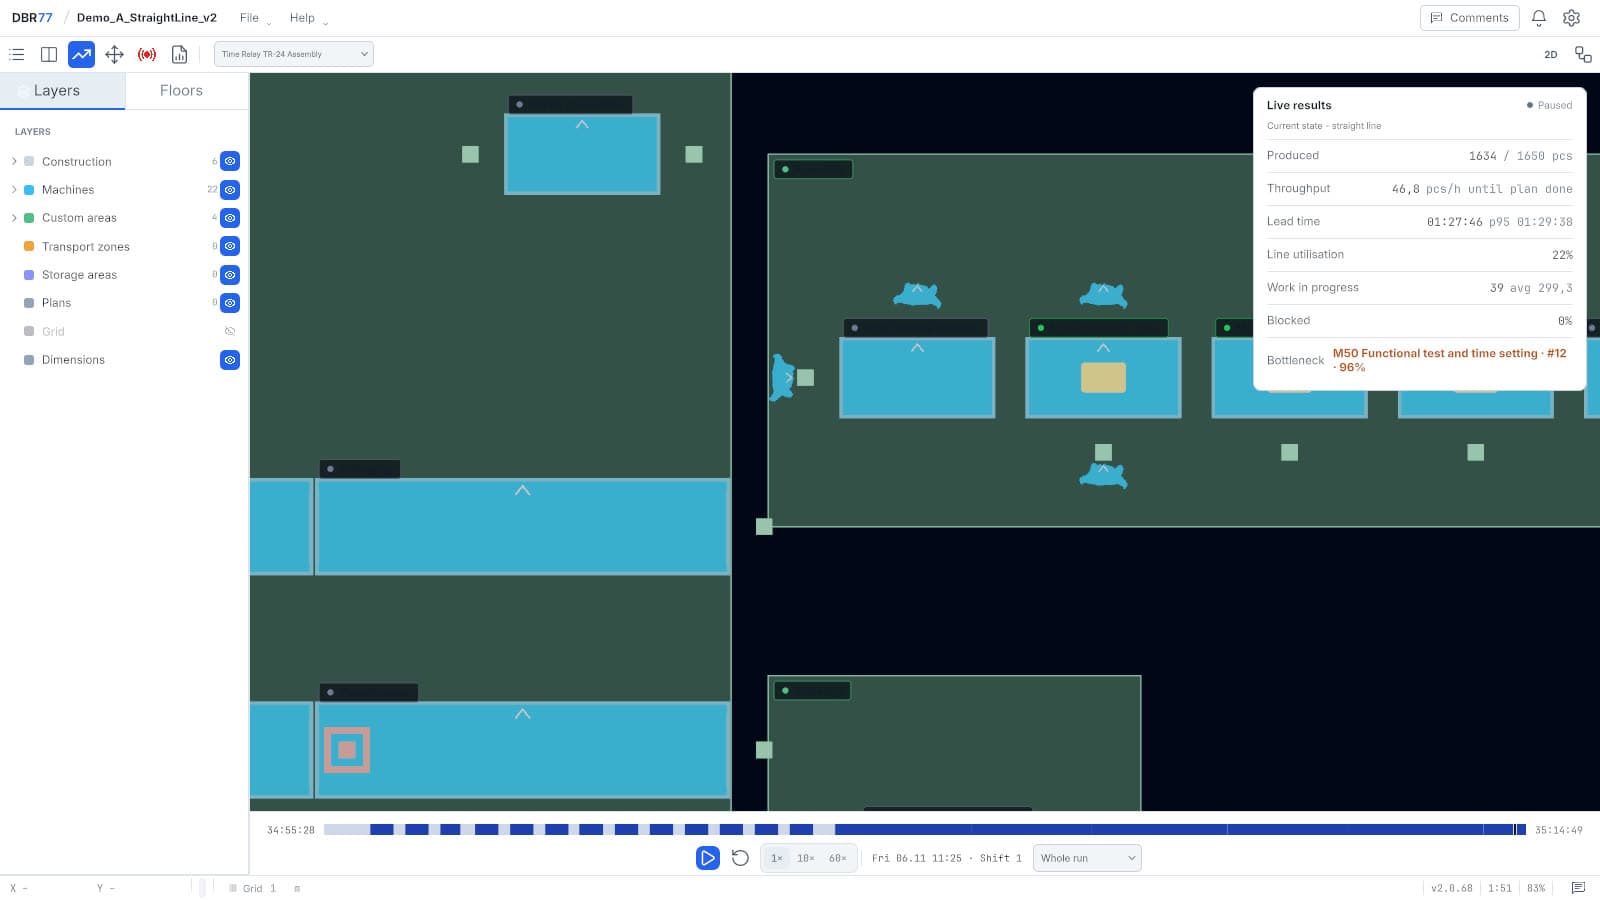
Automation concept: an autonomous cart at the bottleneck
A plant with over 200 people on three shifts. Its processes are injection molding, extrusion, thermoforming, assembly, packaging, quality control and packing. The facility has 20,000 m² and the warehouse 8,000 m².
Results
- The analysis found options to automate intralogistics, including non-ergonomic tasks, and quality control.
- The bottleneck was a manual process at the first operator: 90 seconds of work and 98 seconds of waiting.
Benefits
- A variant analysis of the selected area.
- An informed operational and financial decision on automation.
Industrial automation and robotics
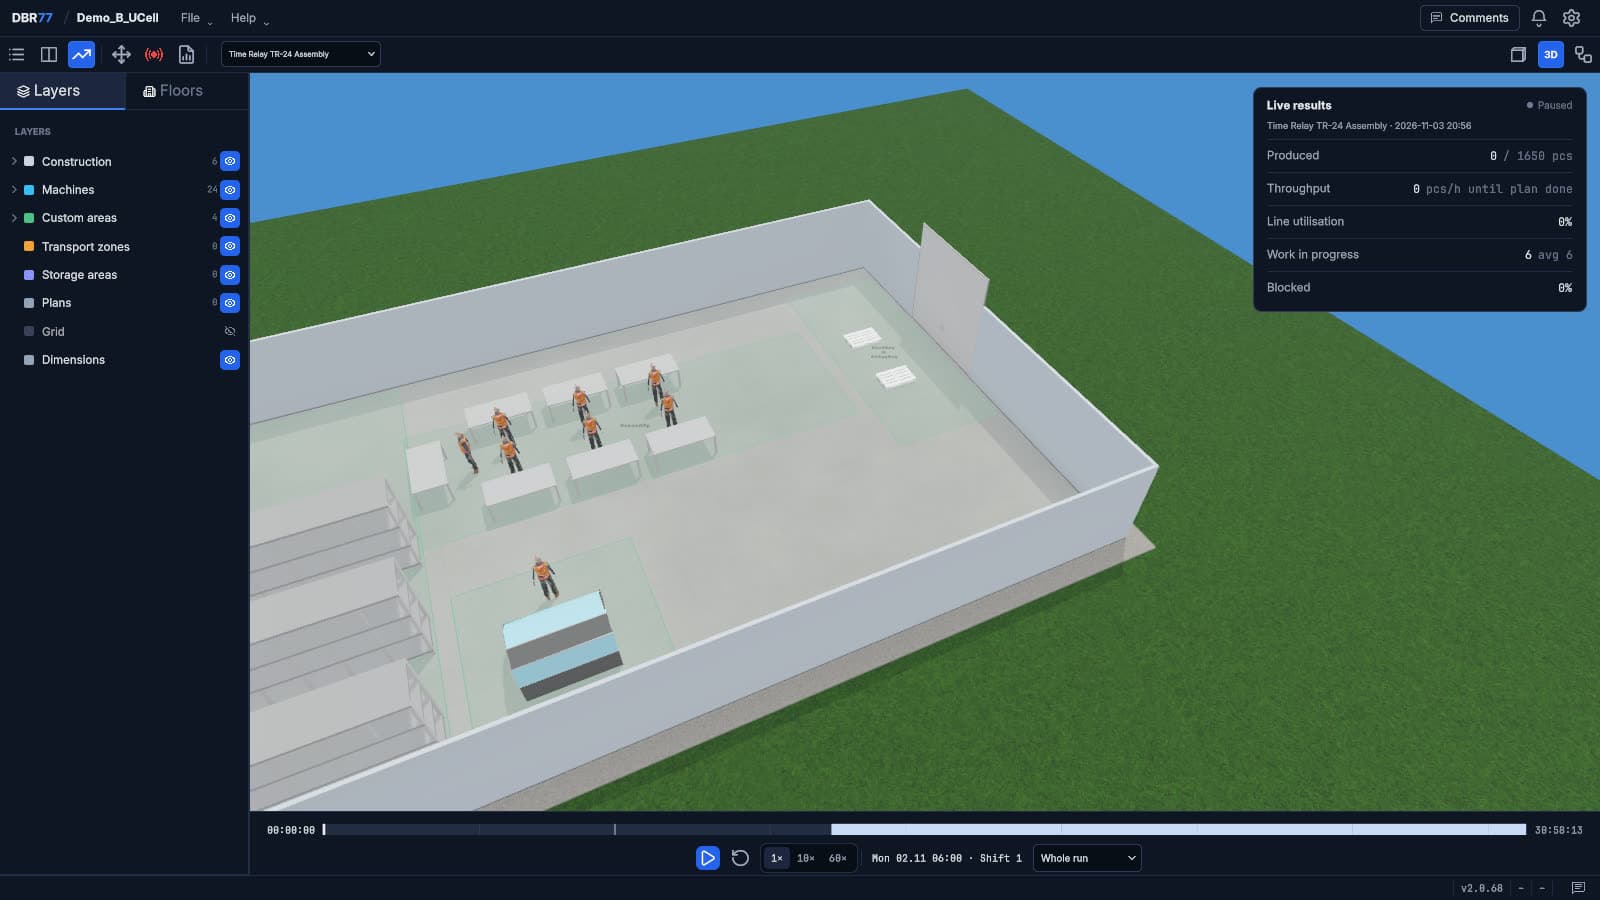
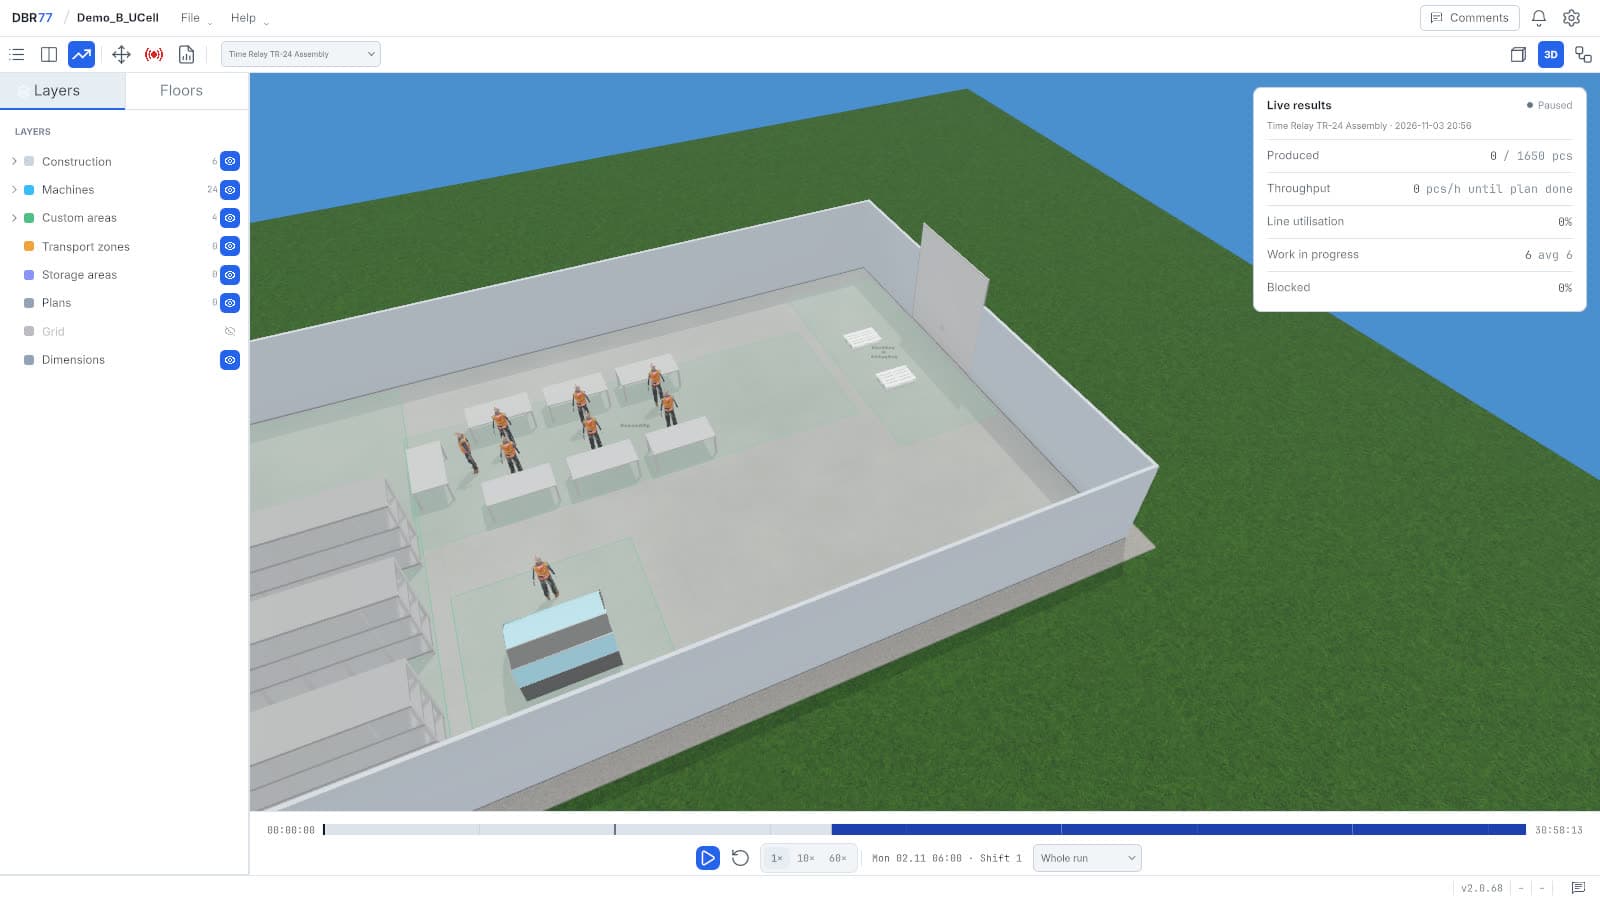
Virtual showroom for Fanuc
Fanuc makes and distributes industrial robots, PLCs, servo drives, motors, CNC systems, visualization and control systems and software, and provides technical support through its engineers.
Results
- Customers reach product information faster, and the showroom attracts more potential buyers.
- Many 3D models, such as grippers, shorten product demonstrations and customization.
Benefits
- Suppliers create and update product presentations quickly.
- Several languages and a customizable interface support sales in other markets.
Next step
Have a decision to test?
Describe your layout and the decision you are weighing. A DBR77 expert will show you how to test it on the digital twin, starting from the data you have.
Sign in or sign up at studio.dbr77.ai.
Frequently asked questions
- What can I use the digital twin for?
- The catalog has six use cases: a new facility or major expansion, a layout change or relocation, intralogistics (milkrun and kanban), warehouse throughput and slotting, line balancing, and supplier presales with an interactive showroom.
- How do I find the use case that fits my plant?
- Filter the catalog by area, goal and maturity stage. Each use-case page lists the typical problems, the outcomes, what you get and the capabilities to start with.
- Do I need a plant that is already running?
- No. For a new facility you design the layout in Studio 3D and test it in Factory Sim before the budget is committed. For an existing plant you start with the routings, cycle times and shift plan you already have.
- Where do the numbers in the examples come from?
- The use-case pages describe the typical outcome without promising a value. Figures appear only in the published case studies, from real projects.