Balance work across stations based on evidence, not gut feel.
Simulate the week on your routings, shifts and buffers to see which change protects throughput and on-time delivery.
Why this matters
Typical pains
A clear view of what breaks in the real world, so the model is built for what actually happens.
A single bottleneck sets your cycle time.
Balancing decisions happen under time pressure each week.
Averages in a spreadsheet hide queues and shared machines.
Outcomes
What improves
A measurable way to evaluate scenario variants and the decisions you will make.
Cycle time
reduced by better balancing
On-time delivery
checked against the plan
Lead time
compared across variants
Deliverables
What you get
A decision-ready package: model, scenarios, and an actionable rollout path.
Deliverables
- Balancing scenarios with KPI comparison
- Decision-ready recommendations: buffer, shorter cycle or parallel station
- Deterministic simulation of the week by station
Recommended capabilities
Start with the minimum set needed for the outcome, then add more data as the use-case matures.
Proof
Case studies
Real scenarios, shown in full under this use case.
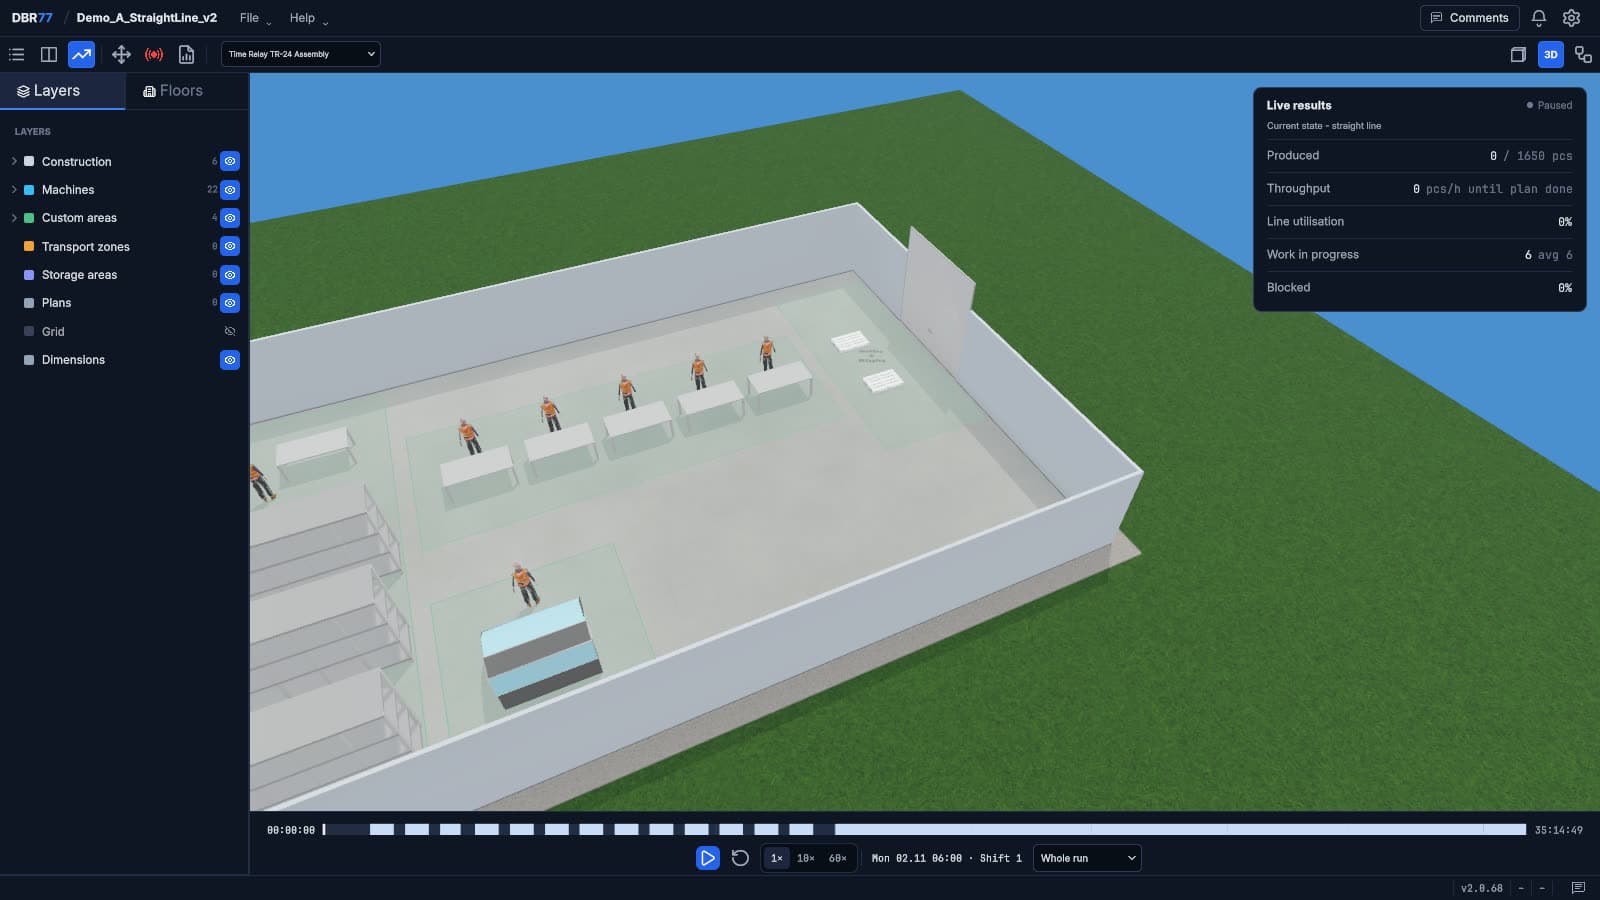
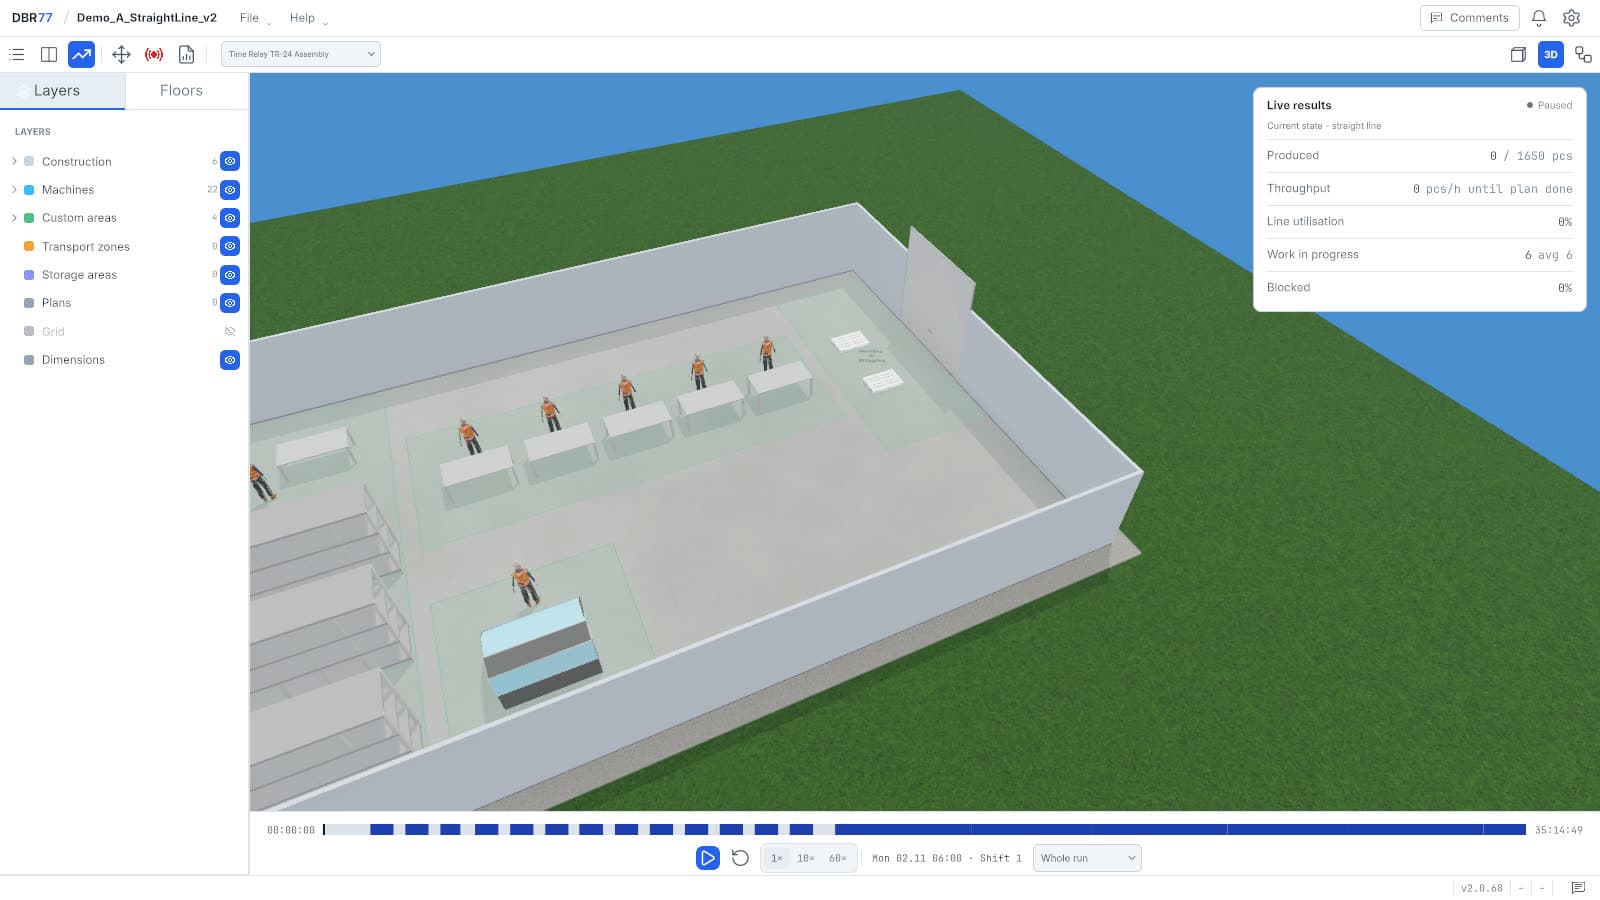
Car lamp manufacturer, southern Poland
Production line design: 6% more output per day
Context
A plant that makes lamps for passenger cars, with 270 people on two shifts. Its processes are injection molding, painting, electroplating, assembly, labeling, quality control and packaging. The building has 28,000 m² and the warehouse 12,000 m².
Task
Design a new production line layout with the best throughput and labor efficiency. The analysis had to include the time material spends moving between workstations and intermediate warehouses, the average production time and the line output per hour.
Work
- Built a digital twin of the material flow.
- Set the working times of the workstations from the times in the project.
- Set standard speeds on the transport routes, including braking and acceleration of the trucks.
- Defined animation paths for the whole material flow.
- Prepared assumptions for three layout variants and compared material flow times and output.
Results
- The best layout placed the buffer warehouse in the middle, between production and assembly.
- Its average material flow time was not the shortest, but daily output was on average 6% higher than in a linear layout without an intermediate warehouse.
- The other layouts lost output because semi-finished parts waited to be picked up between processes.
Benefits
- A multi-variant analysis of the line before any change on the floor.
- The analysis covered both material flow and production capacity for the planned order mix.
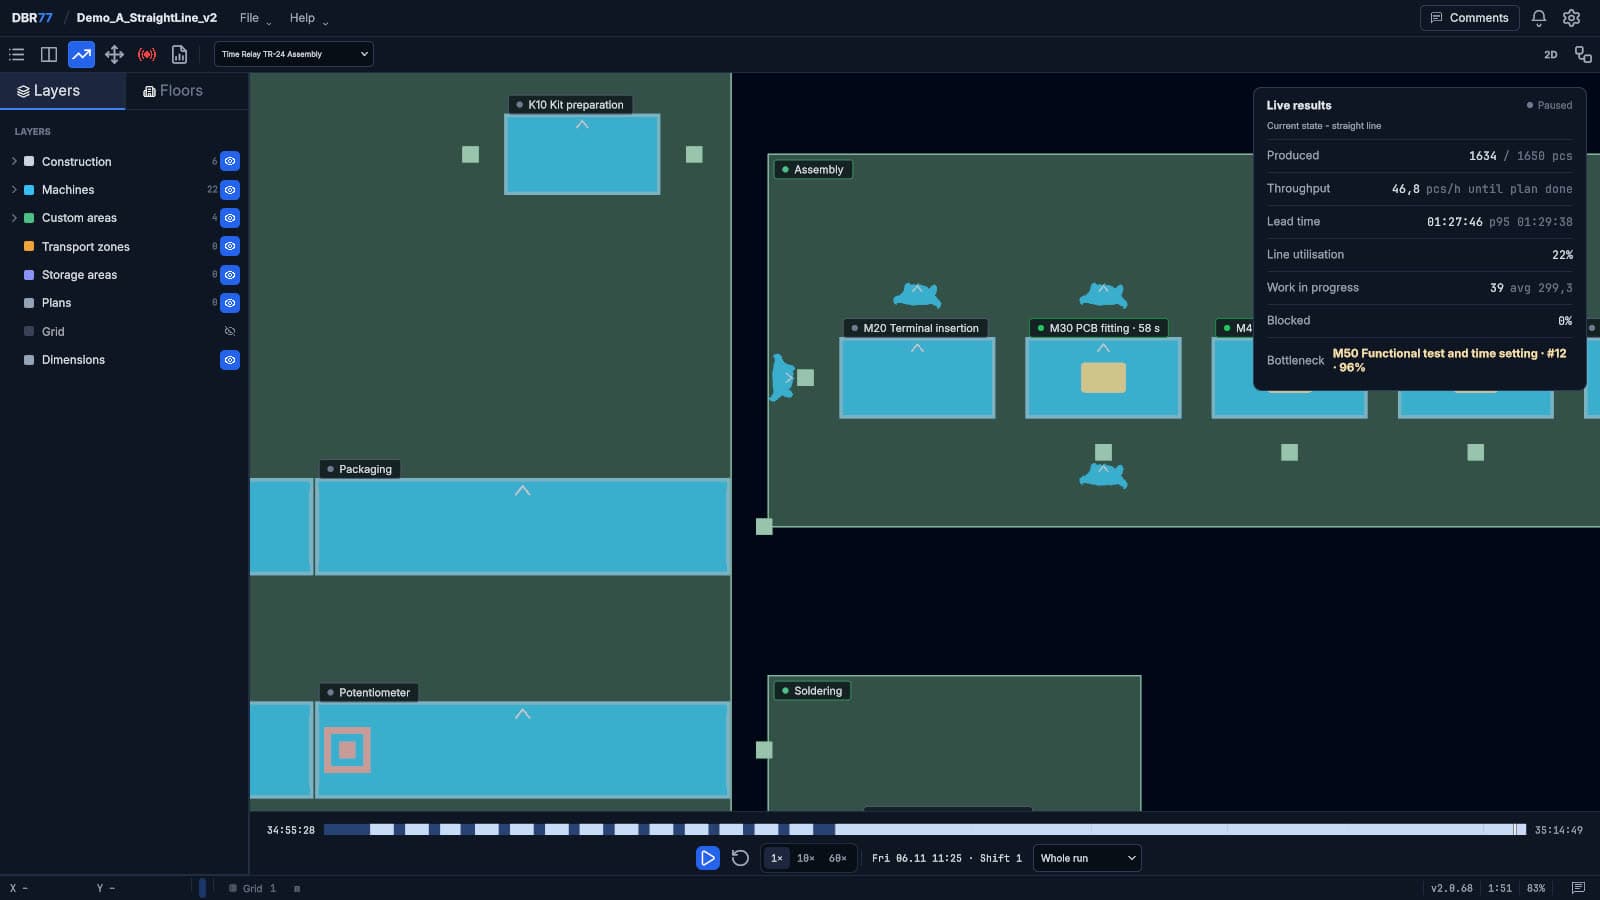
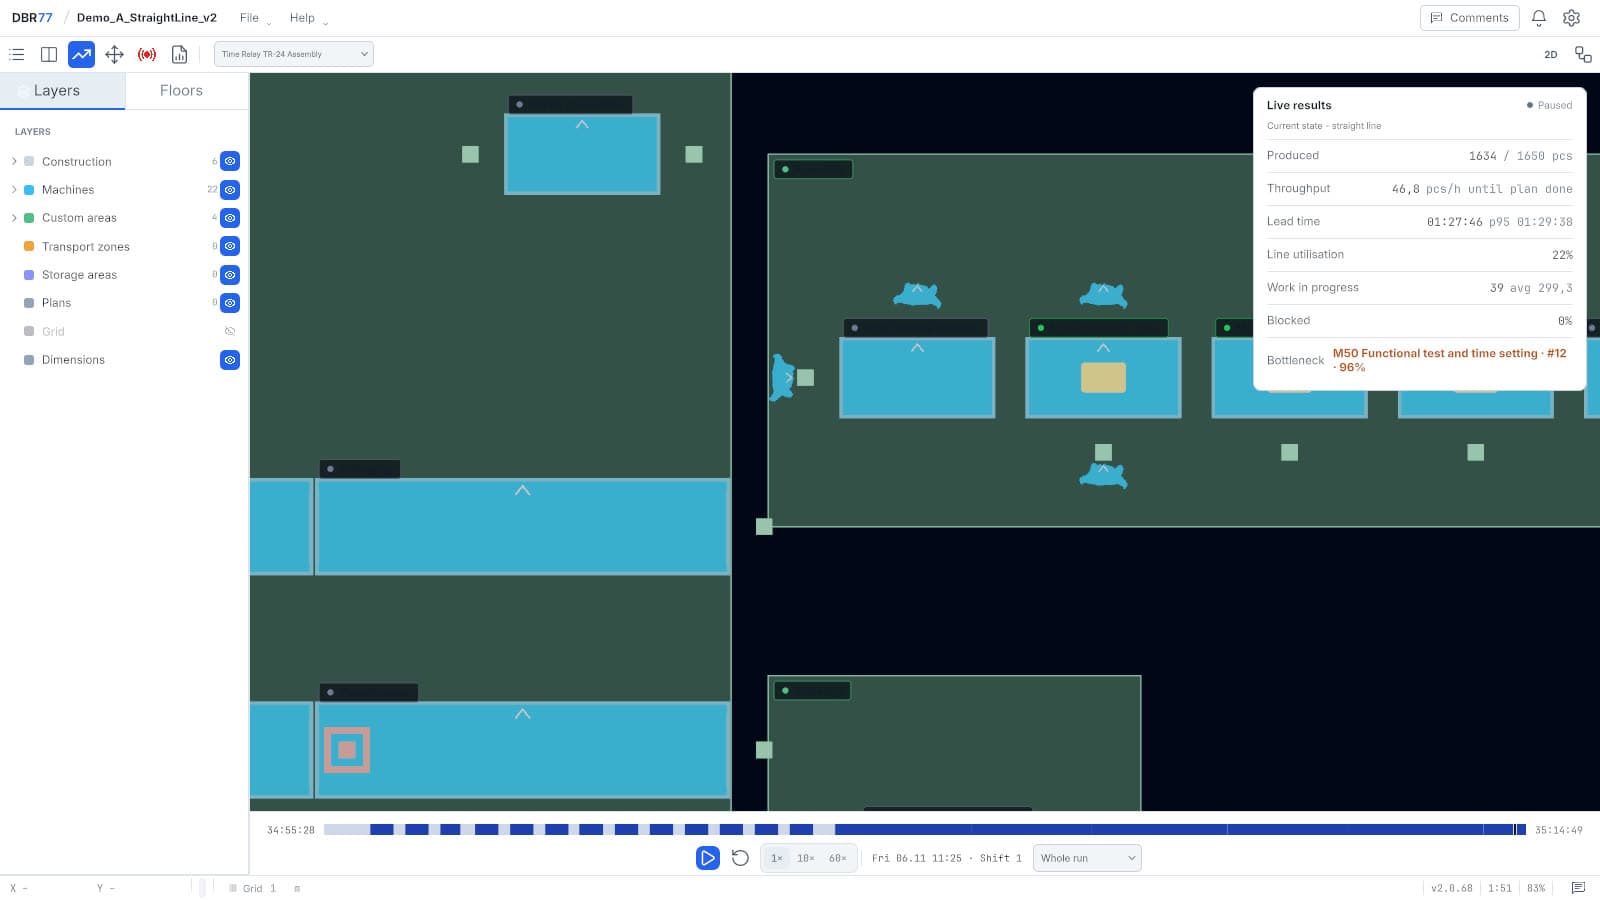
Plastic injection molding for household appliances, central Poland
Automation concept: an autonomous cart at the bottleneck
Context
A plant with over 200 people on three shifts. Its processes are injection molding, extrusion, thermoforming, assembly, packaging, quality control and packing. The facility has 20,000 m² and the warehouse 8,000 m².
Task
Analyze the options to automate and robotize several stations on a line. The analysis covered technical feasibility and the throughput and productivity of the target automated line, with an economic analysis of each option.
Work
- Built a digital twin of the selected part of the plant, with material flows and the process times of each task.
- Selected the tasks with the greatest process, economic and ergonomic weight for automation.
- Prepared alternative automation scenarios.
- In the next iteration, added a simulation of automatic transport between stations.
- Prepared efficiency, productivity and working time reports for every variant.
Results
- The analysis found options to automate intralogistics, including non-ergonomic tasks, and quality control.
- The bottleneck was a manual process at the first operator: 90 seconds of work and 98 seconds of waiting.
- Replacing the operator with an autonomous cart raised efficiency by over 100% and set the conditions for the investment to pay off.
Benefits
- A variant analysis of the selected area.
- An informed operational and financial decision on automation.
- With the target transport concept ready, the company selected a technology provider on DBR77 Marketplace.
Next step
Have a decision to test?
Describe your layout and the decision you are weighing. A DBR77 expert will show you how to test it on the digital twin, starting from the data you have.
Sign in or sign up at studio.dbr77.ai.